...
- leftBankLevel
- leftFloodPlainLevel
- leftMainChannelLevel
- longitudinalProfileMaximum
- longitudinalProfileMinimum
- rightBankLevel
- rightFloodPlainLevel
- rightMainChannelLevel
To visualize model layer elevations when drawing a cross section in a spatial plot, one should use: bottomLayerLevel
topLayerLevelThis applies only for parameters with unit in meters
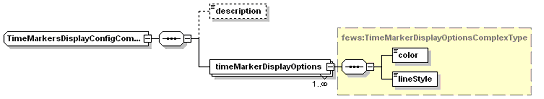
Figure 14 Elements in the TimeMarkersDisplay section of the TimeSeriesDisplay configuration
...