...
The plot display is used to show scalar time series. Each node has its own set of predefined displays configured. When a node is selected the plots display automatically updates the plots which are already displayed to show data for the new node. The first plot configured for the selected node is automatically shown in this display.
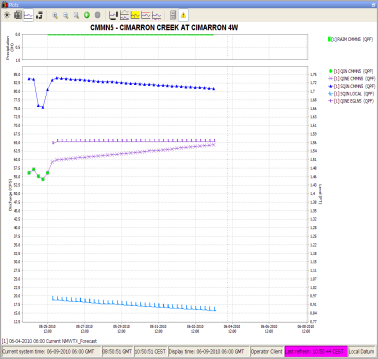
When the IFD is started, there is always at least one plot display available. This plot is called the primary plot display. The primary plot doesn't have lock icon at the left of the toolbar. When a new plot display is started this plot will have a lock icon at the left on the toolbar. When a new plot displayed is started, by default the plot will be locked.

When a plot is locked, the display is locked to that set of time series. When the forecaster moves from basin to basin, the plot will continue to display the original timeseries. The plot is not updated. However, as new data is brought in, the plot is updated with new data.
When the toggle-button is switched off (icon changes to unlock) the plot window is updated automatically when a new node is selected.
...
...
Plot overview
The plot overview is a panel which shows a thumbnail of each plot which is configured for the selected node. This panel gives an overview of the selected node. When a plot is selected the primary plot is automatically updated, also other plots display which are not locked (see previous chapter) are updated.

At the top of the panel there are four buttons. The first button selects the first plot, the second button selects the previous plot, the third button selects the next plot and the last button selects the last plot. 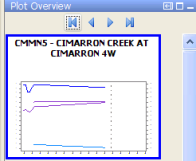
...
...
Forecaster help
The forecaster help panel shows user provided documentation which is available for a node.
Currently the following formats are supported: textfiles, images and pdf-files.
Users can place documents in a directory within a predefined directory.
This directory can be configured in the global.properties by defining the INFORMATION_PANEL_FOLDER property.
Within this directory each node has its own directory. The directory should have the same name as the node id.
Within that directory that documentation for that node can be placed.
Below an example of the tool window forecaster help. In this example the forecaster has two documents available for information.
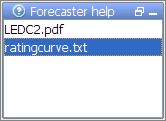
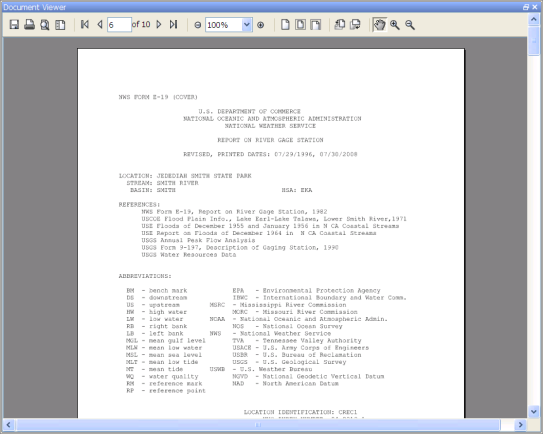
When one of the files is selected in this panel the content of the selected file is shown in the document viewer.
The document viewer is a dockable window in the centre of FEWS.
...
The content of the forecast help dialog is depended of which node is selected in the forecaster panel.
When a new node is selected the content of the forecaster help dialog is automatically updated.
...
Run info
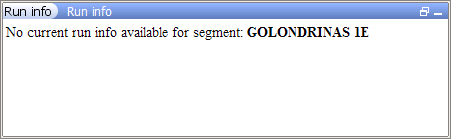
The run info panel shows detail information of the latest run of the workflow of the selected node.
If the workflow of the node has not run yet for the current T0 then the panel will show that there is no current run info available
When the workflow has run. The status can either be succesfull, failed or partly successful.
Only when the workflow was succesfull than the icon of that node will be set to green. The run status will be shown green in the run info box.

When the run is partly successful the icon of that node will be set to the red exclamation mark, the run status box in the run info panel will be set to yellow. When the run is failed the icon of the node will be set to the red exclamation mark, the run status box will be set to red. 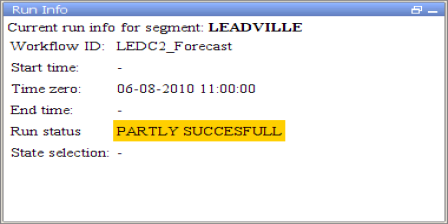
...
...
Forecaster notes
The forecaster notes panel shows the notes other forecaster have created regarding their previous forecasts for the forecast point. Forecasters can also created their own note and publish them.

...
How to create a forecast with the IFD
Steps in creating a forecast
Below is a list of all possible steps in creating a forecast with the IFD. Please
...
Below is a list of all possible steps in creating a forecast with the IFD. Please note that not all of the listed steps are obligated. For each step will be explained how this step can be carried out using the IFD in FEWS.
- Start FEWS
- Selecting the forecast panel
- Reviewing the topology
- Review the list of available state date/times
- Adjust state and/or forecast length
- Starting the forecast process and selecting the workflow for which the forecast should be made
- Reviewing workflow status
- Reviewing graphs (graph display listens to segment selection)
- Reviewing graphs (graph display is independed from segment selection)
- Continue with the forecast process downstream
- Ending the forecast process
...
Starting FEWS
After starting FEWS, the map-display will be displayed in the centre and the Forecast Panel-tab at the left will be selected.
This the default layout. The layout after starting FEWS is however configurable by creating and saving a custom layout by using the option in the File menu at the top left of the display.

First the IFD will try to synchronize the local datastore with the central database.
Until that process is finished it is not possible to create a forecast with the IFD.
To indicate that the IFD is doing its initial synchronization after startup the forecast-button shows a hour glass icon.
While the Operator Client if synchronizing, it is possible to view scalar and spatial data.
When the initial synchronization is finished. The following message is shown. 
...
Selecting the forecast panel
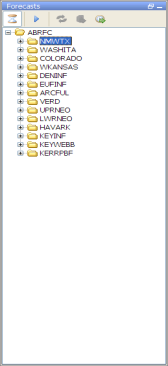
The whole process of creating of forecast by using the IFD is managed by the forecast dialog, therefore the first step is selecting the Forecast tab at the left of the display. The Forecast tab will give an list, in computational order of the basins of the region. 
...
...
Review the list of available state date/times
The forecast panel also shows at the bottom the currently selected (default) warm state. By clicking on the drop-down box all the available warm states are shown. If the forecaster needs to use a different warm state than the default, a new warm state date may be selected from drop down menu titled Warm State Selection. If the default warm state is not correct another warm state can be selected from the drop-down box. 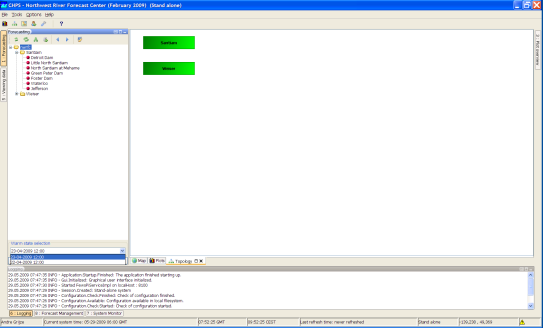
...
Adjust state and/or forecast length
By pressing the Run Options button at the bottom of the forecast dialog the user will have access to alternative ways of selecting states. After pressing the advanced button a dialog will be shown in which the user can select the state, forecast length and a what-if scenario.

After selecting the OK-button the selected state or forecast length will be applied and used in the runs.
...
Starting the forecast process
To start the interactive forecast process, the user should select a leaf node. If the IFD is in forecast mode (which it is by default) the workflow of the selected node will also be automatically run. Models can be run by selecting a node, or pressing the rerun button.
In view mode the forecaster can view data but it is not possible to create a forecast.
...
...
Reviewing run status workflow
When a run is finished the segment-dialog will show the status of the run.
If a run is in progress a refresh-icon will be shown. A green box will indicate a successful run.
A red exclamation mark will indicate that run workflow has failed.
A yellow dot will indicate the workflow has run succesfully but that the results are invalid.
For example when an upstream segment has run later than the workflow for a downstream segment the results of the downstream segment workflow are invalid.
The icons displayed on the leaf node (for individual basins) indicate the status of local runs. If the icon is blank then the server run is the most recent run. Icons on the parent nodes indicate the status of server runs.
...
Review graphs (graph display listens to segment selection)
When a basin run has finished the results of the run should be reviewed. By selecting the plot overview at the right a list of thumbnails will be displayed. For each graph available for the current node a thumbnail will be shown. To display a graph, the forecaster selects a thumbnail and then this graph is displayed in the main plot window. The plot display will show the selected graph. Navigation between the graphs can be done by selecting a graph by clicking on a thumbnail with the mouse or by pressing alt+g (go to next graph) or by pressing shift+alt+g(go to previous graph). When the Thumbnail Panel is selected it is also possible to navigate by using the arrow keys up and down on that panel. When a new node is selected in the Forecast Tab the list of thumbnails is automatically updated to show the graphs available for the newly selected node.
The Plot Overview panel can be undocked. When the display is expanded the plots are automatically resized. 
...
...
Creating a mod in the time series display
Mods can be created in the mods display or directly in the plot display. To modify a time series directly in a plot, a time series has to be selected. This can be done by selecting a time series in the legend of the plot. To indicate that a time series is selected the legend and the time series will be plotted bold. 
...
...
Creating a mod in the mods display
The modifier display can be started by clicking on the wrench-icon at the toolbar or by using the shortcut ctrl+m. The modifier display will show all the mods which are applied in the currently selected segment. By clicking on the create mod-button a new mod can be created. After pressing the create mod-button a list of available mods will be shown. When the mod is created it can be applied by pressing the apply-button. With the run-buttons (rerun, rerun to selected and rerun all to selected) it is possible to rerun the workflows. Pressing the run-buttons will also automatically apply the mod.
...
Continue with the forecast process downstream
After reviewing the graphs and if needed applying mods the forecaster can proceed to the next segment. Going to the next segment can be done easily by pressing alt+s (go to next segment) or by pressing the next segment-button in the forecast panel or by selecting the next node. After selecting the segment the workflow will be run automatically and after finishing the run the status of the run will be shown by color of the dot of the segment.
...
...
Ending the forecast process
When the forecaster thinks that the current forecast is sufficient. The forecast can select the parent node of the leaf nodes and press the 'run on server'-button. When this button is pressed, first all the new modifiers and changes to the existing modifiers of the child nodes of the selected node will be uploaded to the server. When the upload is successful the workflow will be run at the server. The locally created runs will be deleted when the server run was successful and the results are downloaded successfully back to the Operator Client.
...
Dockable windows
| Anchor | ||||
|---|---|---|---|---|
|
...