...
- systemTime
- displayTime
- timeZero
- threshold
- forecastConfidence1
- forecastConfidence2
- forecastConfidence3
Within longitudinal profile displays, the markers can be set to display the minimum or maximum values. A variety of river bed levels can be included in a display if these are specifed in the branches.xml file.
for longitudinal profile:
- leftBankLevel
- leftFloodPlainLevel
- leftMainChannelLevel
- longitudinalProfileMaximum
- longitudinalProfileMinimum
- rightBankLevel
- rightFloodPlainLevel
- rightMainChannelLevel
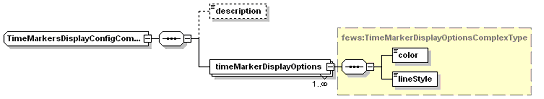
Figure 14 Elements in the TimeMarkersDisplay section of the TimeSeriesDisplay configuration
...