...
- Trends in Sea-Level Trend Analysis
- The Effect of the 18.6-Year Lunar Nodal Cycle on Regional Sea-Level Rise Estimates
...
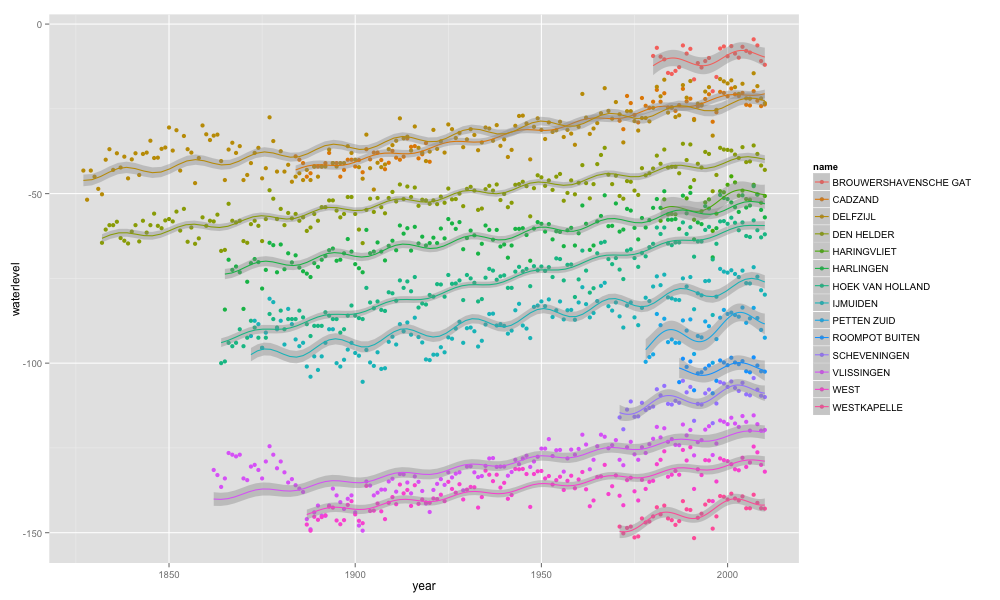
The code below generates the plot of the Dutch tide gauges. Notice that after the last 6 years of (average) sea-level decline we are about to see a rising sea level at the Dutch coast again for the next 12 years.
...