...
The tag line can be used to configure options like:both single or dual y-axis
...
...
Dual y-axis plots
It is possible to display a set of time series with two different parameters types in one plots. One parameter will be displayed on the left axis, the other will be displayed on the right axis.
Below an example of a dual y-axis plot.
 Image Removed
Below an example of how to configure a timeseries which should be displayed on the right y-axis.
have two y-axis visible in the same plot. This can be done by having multiple timeseries where some are assigned to the left y axis and some to the right y axis, or by having a timeseries on the left y axis with an associated rating curve on the right y axis. So every timeseries plot (also in reports) will have a mandatory left y axis to which a timeseries is associated and an optional right y axis to which a timeseries or rating curve is associated.
The display of threshold lines are supported for one y axis. But there can be threshold lines for either the left or the right y axis, but not both.
Multiple TimeSeries plots
To associate a timeseries to the left or right y axis use the <axis> element. This element is optional and leaving it out will associate it (default) to the left axis. Please note that at least one timeseries should be on the left axis (by either settings <axis>left</axis> or leaving the element out and using the default).
Below are two examples of a config and the resulting plot.
...
<plotWeight>1</plotWeight>
			<line>
				<color>blue</color>
				<axis>left</axis>
				<timeSeriesSet>
					<moduleInstanceId>ImportTelemetry</moduleInstanceId>
					<valueType>scalar</valueType>
					<parameterId>H.obs</parameterId>
					<locationId>Hydro1</locationId>
					<timeSeriesType>external historical</timeSeriesType>
					<timeStep unit="minute" multiplier="15"/>
					<relativeViewPeriod unit="hour" start="-36" end="36"/>
					<readWriteMode>editing visible to all future task runs</readWriteMode>
				</timeSeriesSet>
			</line>
			<line>
				<color>blue</color>
				<axis>left</axis>
				<timeSeriesSet>
					<moduleInstanceId>ImportTelemetry</moduleInstanceId>
					<valueType>scalar</valueType>
					<parameterId>H.rated</parameterId>
					<locationId>Hydro3</locationId>
					<timeSeriesType>external historical</timeSeriesType>
					<timeStep unit="minute" multiplier="15"/>
					<relativeViewPeriod unit="hour" start="-36" end="36"/>
					<readWriteMode>editing visible to all future task runs</readWriteMode>
				</timeSeriesSet>
			</line>
			<line>
				<color>red</color>
				<axis>right</axis>
				<timeSeriesSet>
|
|
...
<moduleInstanceId>ImportTelemetry</ |
|
...
moduleInstanceId>
					<valueType>scalar</valueType>
|
|
...
<parameterId>Q.obs</parameterId>
|
|
...
<locationId>Hydro2</locationId>
|
|
...
...
historical</timeSeriesType>
					<timeStep unit="minute" multiplier="15"/>
					<relativeViewPeriod unit="hour" start="-36" end="36"/>
					<readWriteMode>editing visible to all future task runs</readWriteMode>
				</timeSeriesSet>
			</line>
			<line>
				<color>red</color>
				<axis>right</axis>
				<timeSeriesSet>
					<moduleInstanceId>ImportTelemetry</moduleInstanceId>
					<valueType>scalar</valueType>
					<parameterId>Q.rated</parameterId>
					<locationId>Hydro4</locationId>
					<timeSeriesType>external historical</timeSeriesType>
					<timeStep unit="minute" multiplier="15"/>
<relativeViewPeriod unit="hour" start="-36" end=" |
|
...
...
<readWriteMode>editing visible to all future task runs</readWriteMode>
				</timeSeriesSet>
			</line>
		</subplot>
|
|  Image Added Image Added |
| Code Block |
|---|
|
		<subplot>
			<plotWeight>1</plotWeight>
			<line>
|
|
...
<color>blue</color>
				<axis>right</axis>
				<timeSeriesSet>
|
|
...
<moduleInstanceId>ImportTelemetry</ |
|
...
moduleInstanceId>
					<valueType>scalar</valueType>
|
|
...
<parameterId>H.obs</parameterId>
|
|
...
<locationId>Hydro1</locationId>
|
|
...
...
historical</timeSeriesType>
					<timeStep unit="minute" multiplier="15"/>
					<relativeViewPeriod unit="hour" start="-36" end="36"/>
					<readWriteMode>editing visible to all future task runs</readWriteMode>
				</timeSeriesSet>
			</line>
			<line>
				<color>red</color>
				<timeSeriesSet>
					<moduleInstanceId>ImportTelemetry</moduleInstanceId>
					<valueType>scalar</valueType>
					<parameterId>Q.obs</parameterId>
					<locationId>Hydro2</locationId>
					<timeSeriesType>external historical</timeSeriesType>
<timeStep unit="minute" multiplier= |
|
...
"15"/>
					<relativeViewPeriod unit="hour" start="-36" end="36"/>
|
|
...
<readWriteMode>editing visible to all future task runs</readWriteMode>
				</timeSeriesSet>
			</line>
|
|
...
| 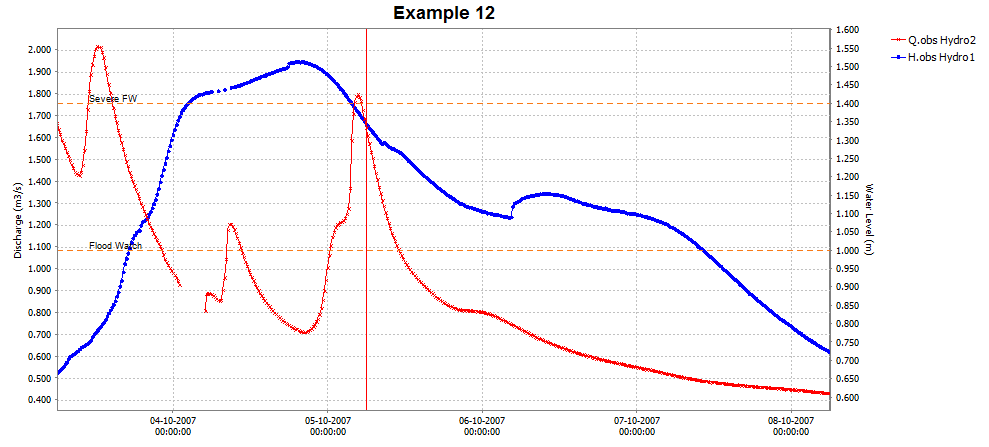 Image Added Image Added
Threshold line only for timeseries on the right y axis |
...
Stage/discharge plots
When a discharge is displayed, it is possible to show the stage on the right axis. It is not possible to configure this rating on the left axis (and the timeseries on the right axis), since a plot has to have at least one timeseries on the left axis.
The right axis is then not a linear axis but the ticks on the right axis are calculated from the discharge ticks on the left axis.
...
The ticks on the right axis are calculated from the value of the discharge on the left axis by using a rating curve.
 Image Removed
Below a an configuration exampleand resulting plot
| Code Block |
|---|
|
<subplot>
			<line>
				<color>black</color>
|
|
...
...
...
<markerStyle>+</markerStyle>
|
|
...
...
...
...
			<moduleInstanceId>ImportTelemetry</moduleInstanceId>
					<valueType>scalar</valueType>
					<parameterId>Q.rated</parameterId>
					<locationId>Hydro4</locationId>
					<timeSeriesType>external historical</timeSeriesType>
					<timeStep unit="minute" multiplier="15"/>
					<relativeViewPeriod unit="hour" start="-36" end="36"/>
					<readWriteMode>editing visible to all future task runs</readWriteMode>
				</timeSeriesSet>
			</line>
			<line>
				<color>black</color>
				<lineStyle>solid</lineStyle>
				<markerStyle>circle</markerStyle>
				<markerSize>6</markerSize>
				<axis>left</axis>
				<ratingAxis>
					<parameterGroupId>Water Level</parameterGroupId>
					<transformationType>dischargeStage</transformationType>
				</ratingAxis>
				<timeSeriesSet>
|
|
...
		<moduleInstanceId>ImportTelemetry</moduleInstanceId>
					<valueType>scalar</valueType>
|
|
...
<parameterId>Q.obs</parameterId>
|
|
...
<locationId>Hydro2</locationId>
|
|
...
...
historical</timeSeriesType>
<timeStep unit=" |
|
...
...
...
<relativeViewPeriod unit="hour" start="-36" end="36"/>
					<readWriteMode>editing visible to all future task runs</readWriteMode>
				</timeSeriesSet>
			</line>
		</subplot>
|
|  Image Added Image Added |
display
Definition of a pre-configured display. Each display may contain multiple sub-plots. Multiple displays may be defined per display group.
...