...
Time series display markers are informative lines in the display. These may be defined to display vertical lines for times values of interest. The configuration of horizontal threshold lines is also included in this definition. Markers can be defined for three time values as well as for the thresholds;
...
- systemTime
- displayTime
- timeZero
- threshold
The following marker options can be used to display forecast confidence time spans in the time series display. Up to three forecast confidence time spans can be defined for each sub plot in the displayGroups configuration file.
- forecastConfidence1
- forecastConfidence2
- forecastConfidence3
...
for longitudinal profile:
- riverBedLevel
- leftBankLevel
- leftFloodPlainLevel
- leftMainChannelLevel
- longitudinalProfileMaximum
- longitudinalProfileMinimum
- rightBankLevel
- rightFloodPlainLevel
- rightMainChannelLevel
To visualize model layer elevations when drawing a cross section in a spatial plot, one should use:
- bottomLayerLevel
- topLayerLevel
...
- This applies only for parameters with unit in meters
It is possible to display vertical lines in the slider bar in the spatial display that mark the start and/or end times of the displayed grid time series. These markers will only be visible when more than one grid is displayed, i.e. multiple data layers in one grid plot. In that case the start and/or end times can be different for each grid time series. These markers are configurable using the following marker options in the time markers display configuration:
- startTime
- endTime
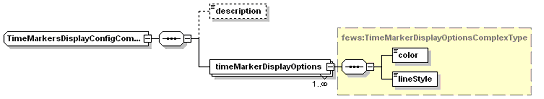
Figure 14 Elements in the TimeMarkersDisplay section of the TimeSeriesDisplay configuration
...