...
| Code Block | ||||
|---|---|---|---|---|
| ||||
<statisticalFunction function="longTermPeriodic" label="Long Term Periodic" ignoreMissings="true"> <statisticType type="MIN" label="Minimum"/> <statisticType type="MAX" label="Maximum"/> <statisticType type="PERCENTILEEXCEEDENCE" value="50" label="50 percentiel"/> </statisticalFunction> |

combinedTimeSeriesStatisticalFunctions
This option add a new timeseries to a plot which is the result of a statistical operation based the available timeseries in that plot. It will be filtered per parameter. E.g. if you have 4 waterlevel timeseries of 4 different gauges and you select the MAX statisticType, a new timeseries with the maximum value (per timestep) of those 4 gauges will be plotted.
| Code Block | ||||
|---|---|---|---|---|
| ||||
	<combinedTimeSeriesStatisticalFunctions>
		<combinedTimeSeriesStatisticalFunction>
			<statisticType>MAX</statisticType>
		</combinedTimeSeriesStatisticalFunction>
		<combinedTimeSeriesStatisticalFunction>
			<statisticType>WEIGHTED_AVERAGE</statisticType>
			<weightAttributeId>AREA</weightAttributeId>
		</combinedTimeSeriesStatisticalFunction>
		<combinedTimeSeriesStatisticalFunction>
			<statisticType>SUM</statisticType>
		</combinedTimeSeriesStatisticalFunction>
</combinedTimeSeriesStatisticalFunctions> |
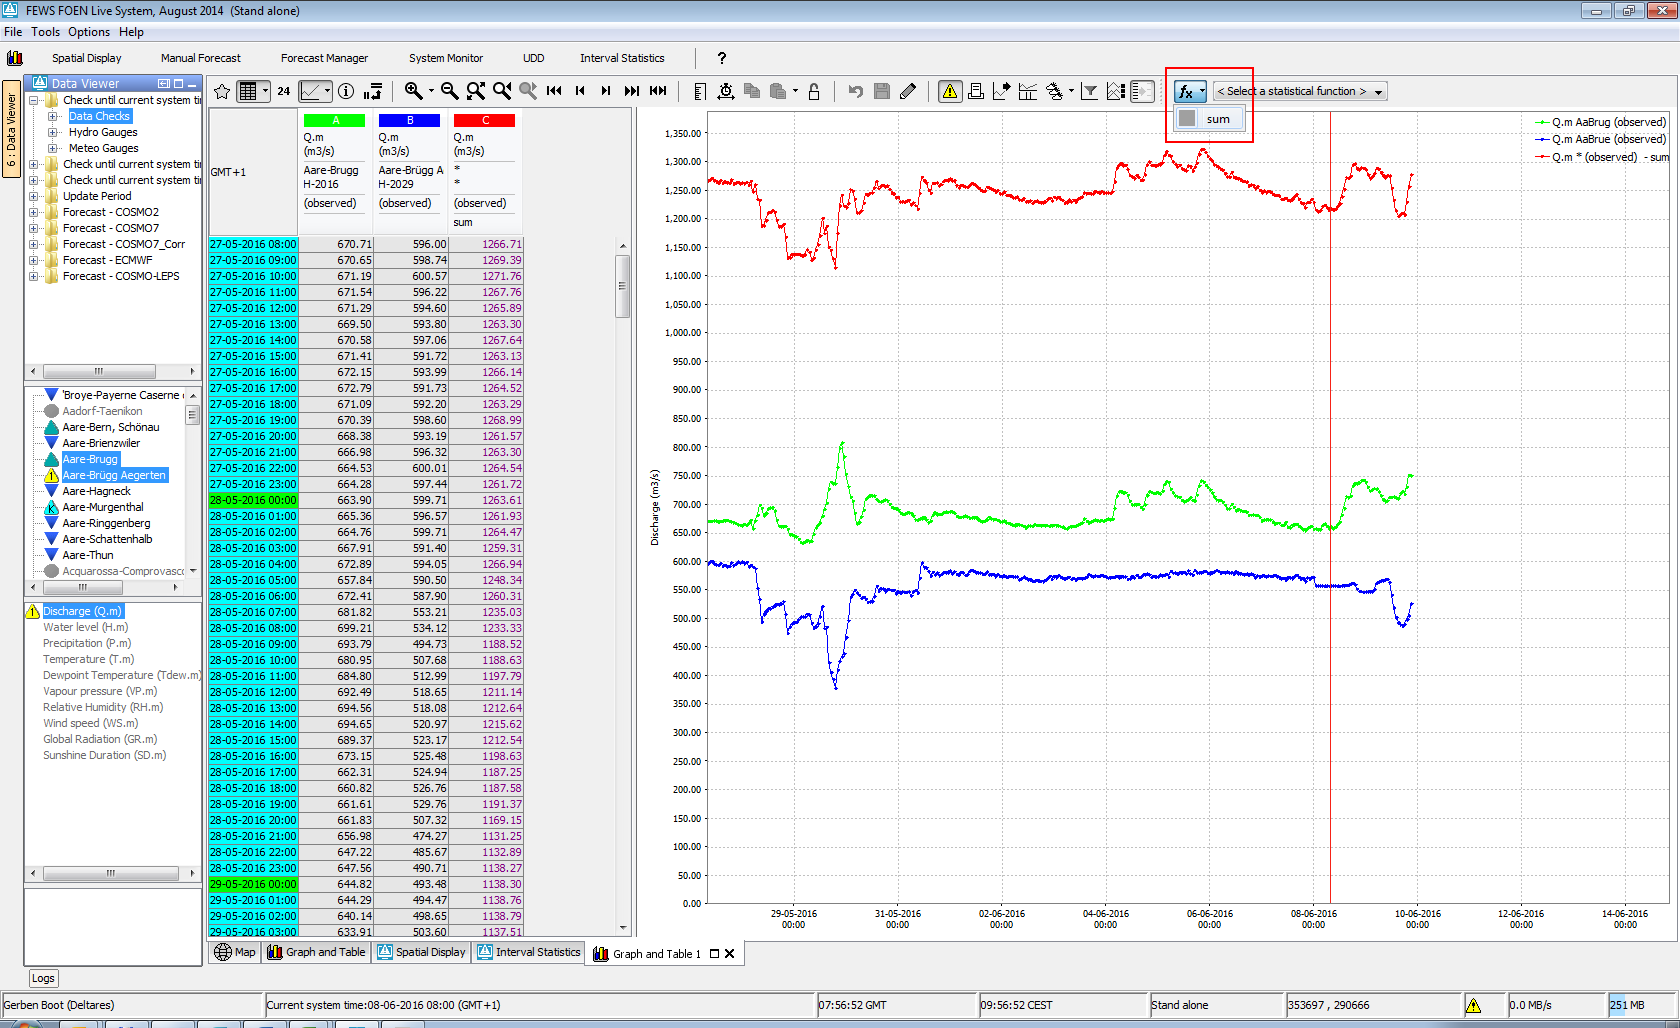
When this is configured a dropdown button will appear on the left of the statistic functions.
In the screenshot below the red time series has been added which is the sum of the green and blue time series:
Descriptive Function Group
...