...
The top part lists modifiers created for the currently selected node (modifier table). It Each row represents a modifier and contains its type, name, summary, locations, start and end times, valid time, user (=who created the modifier), creation time and expiry time. It also allows you to (in)activate, delete and copy modifiers (see below). Modifiers for a local run have a salmon background color. Modifiers for server runs have a green background and are saved to the server.
The bottom part shows the details of a selected modifier (modifier editor).
The splitter between the overview and the editor is stored in user_settings.ini. When the application is reopened, the splitter appears at the previously set position.
...
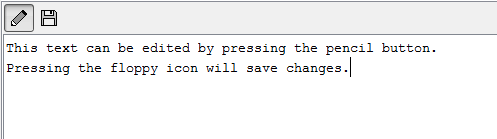
When a text file is selected, it can also be edited. To facilitate this an edit and save button are displayed above the document when selecting a text file (*.txt or *.xml).
Run info
The run info panel shows detail information of the latest run of the workflow of the selected node.
This panel needs to be enabled, see How to define an ExplorerTask - what are the possible taskClass options?
...
The philosophy: Local runs are used by the operator to interactively run a workflow on the operator client, check the results and potentially optimize a forecast by means of modifiers. Once the operator is satisfied with the forecast results, a server run is started and the results can be shared between operators. Local runs will not store any time series in the central Delft-FEWS database, only time series from server runs are stored in the central database.
...
- Local run results are only available in the local OC and are removed from the database when the application is closed/restarted.
- Server run results (and the modifiers of this run) are stored in the central database and are available from any OC.
- Local run results overrule server run results on the operator client. Even when a server run is started after a local run. This means server run results won't be visible in displays as long as the local run exists in the localDataStore.
- When the local runs are configured as child nodes of the server run, the local runs will be removed upon completion of the server run, and thus the results of the server run will be visible.
- When the local runs are configured as separate nodes, and not as child nodes of the server run, the local runs won't be removed and thus the results of the local runs will be visible.
The fact that local run results overrule server run results mean that the server run results won't be visible in graphs or spatial display, even for the operator who started the server run. As this behavior is not always wanted, this can be changed with the topology chosen in the IFD. Below are two different approaches to this.
...
How to create a forecast with the IFD
...
Below is a list of all possible steps in creating a forecast with the IFD. Please note that not all of the listed steps are obligated.required.
| Table of Contents | ||||
|---|---|---|---|---|
|
- Start Delft-FEWS
- Selecting the forecast panel
- Reviewing the topology
- Review the list of available state date/times
- Adjust state and/or forecast length
- Starting the forecast process and selecting the workflow for which the forecast should be made
- Reviewing workflow status
- Reviewing graphs (graph display listens to topology selection)
- Reviewing graphs (graph display is independent from topology selection)
- Continue with the forecast process downstream
- Ending the forecast process
Starting Delft-FEWS
After starting FEWS, the Map display will be displayed in the centre and the Forecast Panel-tab at the left will be selected.
This the default layout. The layout after starting Delft-FEWS is however configurable by creating and saving a custom layout by using the option Save layout in the File menu.
...
While the Operator Client if synchronizing, it is already possible to view scalar and spatial data. When the initial synchronization is finished the icon will change to a pencil icon to indicate that it is possible to create modifiers.
Selecting the forecast panel
The whole process of creating a forecast by using the IFD is managed by the forecast panel, therefore the first step is selecting the Forecast tab at the left of the display. The Forecast tab will give an list, in computational order of the basins of the region. 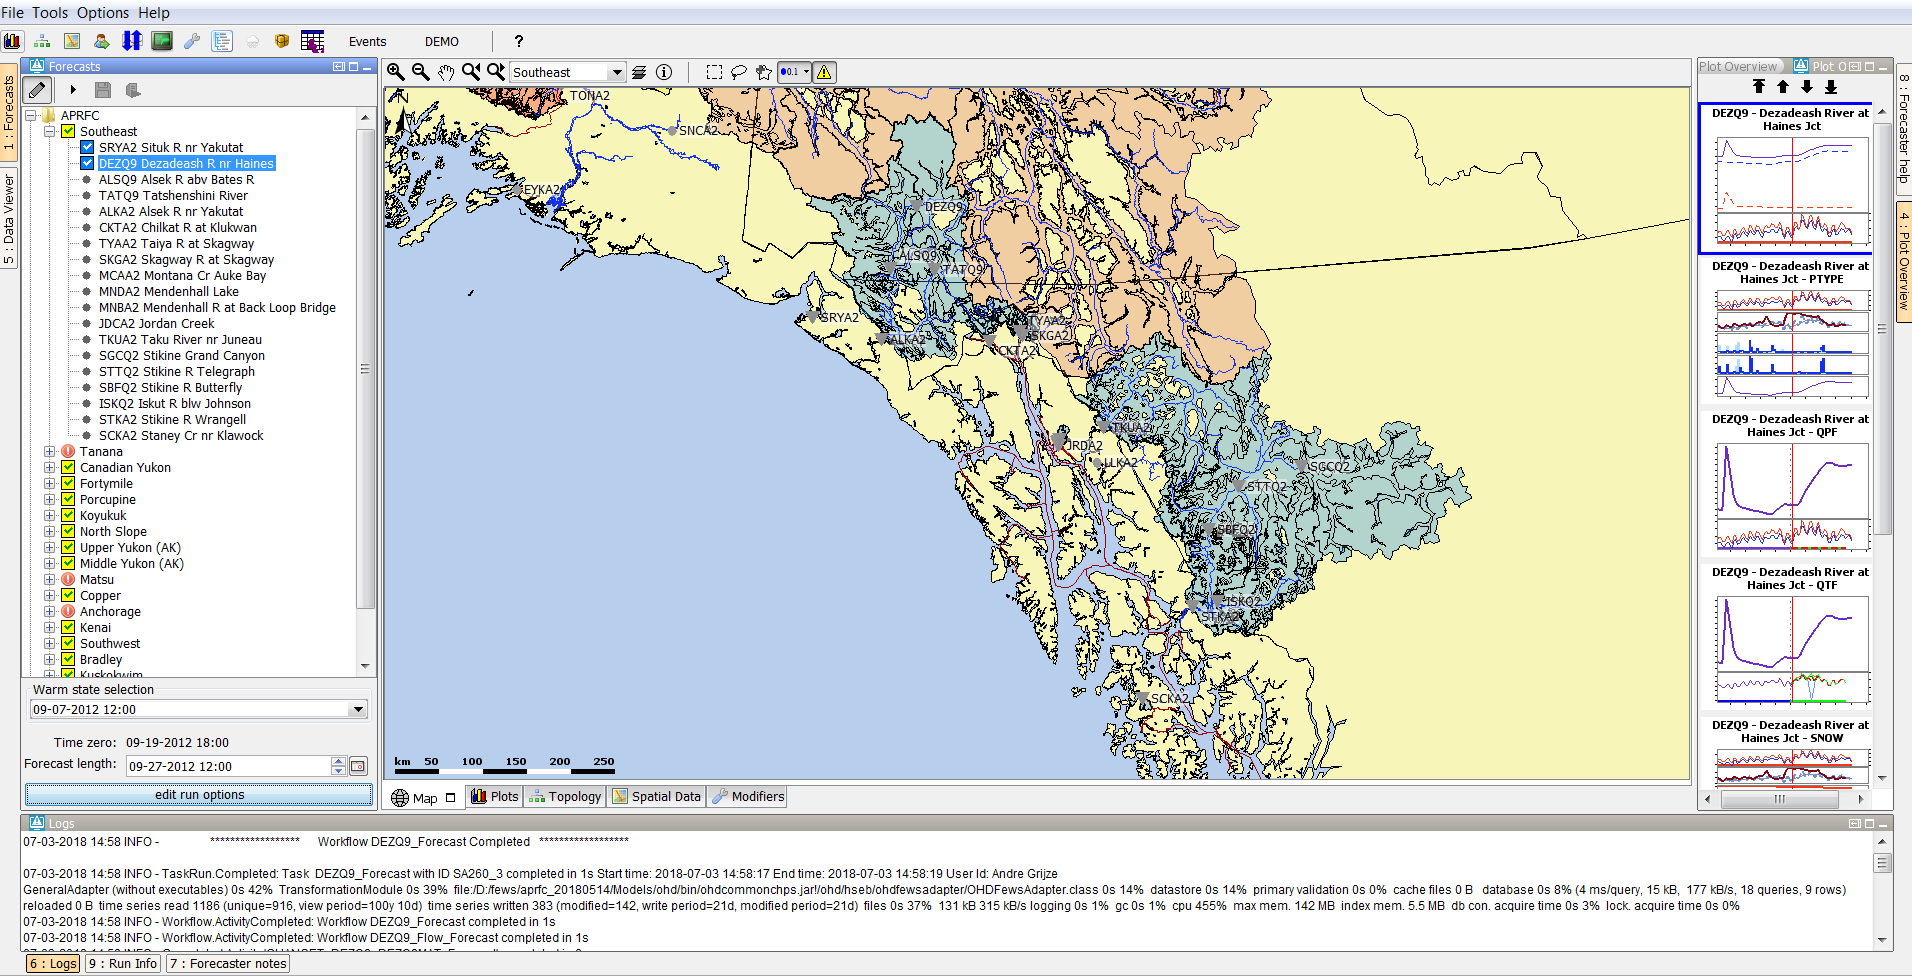
Review the list of available state date/times
The forecast panel also shows at the bottom the currently selected (default) warm state. By clicking on the drop-down box all the available warm states are shown. If the forecaster needs to use a different warm state than the default, a new warm state date may be selected from drop down menu titled Warm State Selection. If the default warm state is not correct another warm state can be selected from the drop-down box.
...
If t0 = 26-06-2021 22:00:00 and Warm state selection = 25-06-2021 20:00:00 the following search period is logged: : "Warm state selection -50 hour to -26 hour, 1 day"
Adjust state and/or forecast length
By pressing the Edit Run Options button at the bottom of the forecast dialog the user will have access to alternative ways of selecting states. After pressing the advanced button a dialog will be shown in which the user can select the state, forecast length and a what-if scenario.
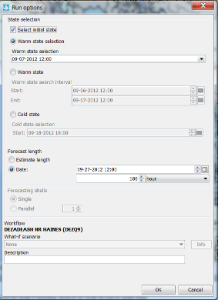
After selecting the OK-button the selected task properties will be applied and used in the runs.
Starting the forecast process
To start the interactive forecast process, the user should select a local run node and run the workflow of that node.
Reviewing run status workflow
The icons in the forecast tree indicate the status of the workflow of a node. A refresh-icon indicate that a workflow is running. An hourglass indicates that a workflow is scheduled to run. More details about the icons can be found in 24 Topology
Review graphs (graph display listens to segment selection)
When a run has finished the results of the run should be reviewed. By selecting the plot overview at the right a list of thumbnails will be displayed. For each graph available for the current node a thumbnail will be shown. To display a graph, the forecaster selects a thumbnail and then this graph is displayed in the main plot window. The plot display will show the selected graph. The Plot Overview panel can be undocked. When the display is expanded the plots are automatically resized.
Creating a mod in the time series display
Mods can be created in the mods display or directly in the plot display. To modify a time series directly in a plot, a time series has to be selected. This can be done by selecting a time series in the legend of the plot.
Creating a mod in the mods display
The modifier display can be started by clicking on the wrench-icon at the toolbar or by using the shortcut ctrl+m. The modifier display will show all the mods which are applied in the currently selected segment. By clicking on the create mod-button a new mod can be created. After pressing the create mod-button a list of available mods will be shown. When the mod is created it can be applied by pressing the apply-button. With the run-buttons (rerun, rerun to selected and rerun all to selected) it is possible to rerun the workflows. Pressing the run-buttons will also automatically apply the mod.
Continue with the forecast process downstream
After reviewing the graphs and if needed applying mods the forecaster can proceed to the next segment.
Ending the forecast process
When the forecaster thinks that the current forecast is sufficient. The forecast can select the parent node of the leaf nodes and press the 'run on server'-button. When this button is pressed, first all the new modifiers and changes to the existing modifiers of the child nodes of the selected node will be uploaded to the server. When the upload is successful the workflow will be run at the server. The locally created runs will be deleted when the server run was successful and the results are downloaded successfully back to the Operator Client.
...