...
Used to specify attributes that should apply to several gridPlots. Specifying which gridPlots the defaults apply to can be done through parameterGroupId, plotGroupId or plotId. When an attribute that is specified through defaults is needed, FEWS will search for the first defaults that contains the needed attribute and applies to the current gridPlot. If no parameterGroupId, no plotGroupId and no plotId is specified, the defaults is considered to apply to all gridPlots. Note that such a general defaults may override settings made in more specific defaults if it is found first by FEWS, when this occurs try specifying the most general defaults last.
timeDisplayLabels
When specified, the external forecast time and current time are plotted on the configured position on the map. In case of multiple forecasts, only the latest forecast time is displayed. By default (i.e. when option is not configured) no time labels are displayed on the map.
gridPlotGroup
Definition of a group in the grid display. Each group may have its own set of maps and time series to display. Defining groups creates a tree view in the left of the display (see example above). Multiple instances may exist.
...
- id : Id of the grid plot- this is used in the tree view. If not unique, a warning will be logged.
- name : Optional name of the grid plot- used for reference purposes only
- contourlinescolor: required when the "contourlines button" in the griddisplay should be enabled
...
- position: legend can be placed on the right, on the left, at the top or at the bottom. Default is on the right.
- width: width of the bar in pixels. Default is 40 pixels.
- length: length of the bar in pixels. The defaults are 400 pixels for legend on the right/left, and for the legend at the top/bottom the length equals the width of the window.
- labelsInside: if true, ticks and labels are displayed inside the legend bar. By default (false) labels and ticks are placed outside the color bar.
- labelsColor (since 2021.01): color of the tick label texts. If omitted, the outside labels are black and the inside labels are white.
- labelsBackgroundColor (since 2021.01): background color of the tick labels. If omitted, white color is used. Note that this option is not implemented for inside ticks and labels (i.e.: labelsInside=true).
- labelsBackgroundOpaquenessPercentage (since 2021.01): transparency/opaqueness of the background of the tick labels. 0% is completely transparent and 100% is completely opaque. If omitted then the background is not transparent. Note that this option is not implemented for inside ticks and labels (i.e.: labelsInside=true).
- logarithmic (since 2024.01, backported to 2023.01): if true the legend ticks and color breaks are spaced logarithmically.
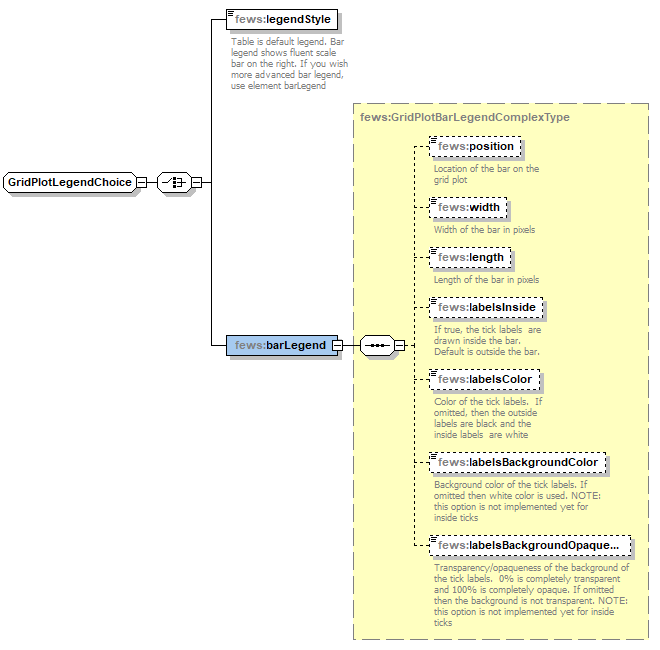
Elements of the configuration of legend style
...
When a sigmaScaleReferenceTimeSeriesSet is configured, a vertical slider becomes automatically visible in GridDisplay to slide through the water column, displaying the 2D model results at a arbitrary water depth. The values displayed are dynamically interpolated between the sigma layers of the model, but only for the visible time step for performance reasons. The range of the slider is automatically adjusted to all available water depths for whole period, however you can limit this range using the <verticalSliderRange> option. By default 100 ticks with 10 intervals each are visible at the vertical slider. Since FEWS 2021.01 you can control the tick distance with the interval attribute in the verticalSliderRange. The direction is controlled with verticalPositiveDirection in the parameters.xml of the sigmaScaleReferenceTimeSeriesSet parameter. See for a config example Sigmalayers - display D-FlowFM 3D results in GridDisplay.
Since 2022.02 ticks can be configured with irregular spacings. The following config is for 5 irregularly spaced tick marks:
| Code Block | ||
|---|---|---|
| ||
<verticalSliderRange start="0" end="-1000" ticks="0,-1,-10,-22,-1000"></verticalSliderRange> |
| Info | ||
|---|---|---|
| ||
The time slider ticks at the | ||
| Info | ||
| ||
The time slider ticks at the top of the gridDisplay are always colored are according to the top layer, even when a different depth is selected in the vertical slider. |
...
Option to set the speed (in milliseconds per frame) for an animation. Default value is 200 milliseconds. Available since 2019.02.
workflow
Adds a run button to the toolbar. When the user hits this button the configured workflow is started. The point or area selected at the map is added to the task run properties which can be used in the workflow. The selected area can be exported by the general adapter as a shape file. A popup is displayed before the run is started to allow the user to enter additional properties. When the sketch type is configured a popup is displayed for the wrong sketch type before the workflow is started
...
Definition of colors to use in displaying the dynamic grid. These are also shown in the legend on the left of the grid display (see example elsewhere on this page). Optional when default class breaks are available for this plot group and parameter group.
Figure 145 Elements of the configuration of class breaks
Classbreaks can also be configured in the TimeSeriesDisplayConfig.xml file . If this functionality is used, a reference to the classBreakId is required. When using the Deft-FEWS Web-OC, all classbreaks need to be configured this way otherwise no legend is shown in the WMS layer of the spatial display.
<classBreaksId>rainfall</classBreaksId>
description
Optional description. Since FEWS 2017.01 it is allowed to have multiple class breaks for a plot. The user can switch between the class breaks with a drop down list. This description is used in the drop down list.
...
| Code Block | ||||
|---|---|---|---|---|
| ||||
<?xml version="1.0" encoding="UTF-8"?> <gridPlotGroups xmlns="http://www.wldelft.nl/fews" xmlns:xsi="http://www.w3.org/2001/XMLSchema-instance" xsi:schemaLocation="http://www.wldelft.nl/fews httphttps://fewsfewsdocs.wldelftdeltares.nl/schemas/version1.0/gridPlotGroups.xsd"> <gridPlotGroup id="DFlow-FM" name="DFlow-FM"> <gridPlot id="Observed" name="Observed2"> <timeSeriesSet> <moduleInstanceId>Import_Telemetry</moduleInstanceId> <valueType>grid</valueType> <parameterId>P.obs</parameterId> <locationId>Delft3DFM_PROI1</locationId> <timeSeriesType>external historical</timeSeriesType> <timeStep unit="hour"/> <relativeViewPeriod unit="hour" start="-96" end="48"/> <readWriteMode>read only</readWriteMode> </timeSeriesSet> </gridPlot> <gridPlot id="Forecast" name="Forecast"> <timeSeriesSet> <moduleInstanceId>Import_Telemetry</moduleInstanceId> <valueType>grid</valueType> <parameterId>P.obs</parameterId> <locationId>Delft3DFM_PROI1</locationId> <timeSeriesType>external historical</timeSeriesType> <timeStep unit="hour"/> <relativeViewPeriod unit="hour" start="-96" end="48"/> <readWriteMode>read only</readWriteMode> </timeSeriesSet> </gridPlot> </gridPlotGroup> </gridPlotGroups> |
...
| Code Block | ||||
|---|---|---|---|---|
| ||||
<?xml version="1.0" encoding="UTF-8"?> <gridDisplay xmlns="http://www.wldelft.nl/fews" xmlns:xsi="http://www.w3.org/2001/XMLSchema-instance" xsi:schemaLocation="http://www.wldelft.nl/fews httphttps://fewsfewsdocs.wldelftdeltares.nl/schemas/version1.0/gridDisplay.xsd"> ...... <gridPlotGroupId>DFlow-FM</gridPlotGroupId> </gridDisplay> |
...
Showing T0 or last import time underneath plot
work in progress