...
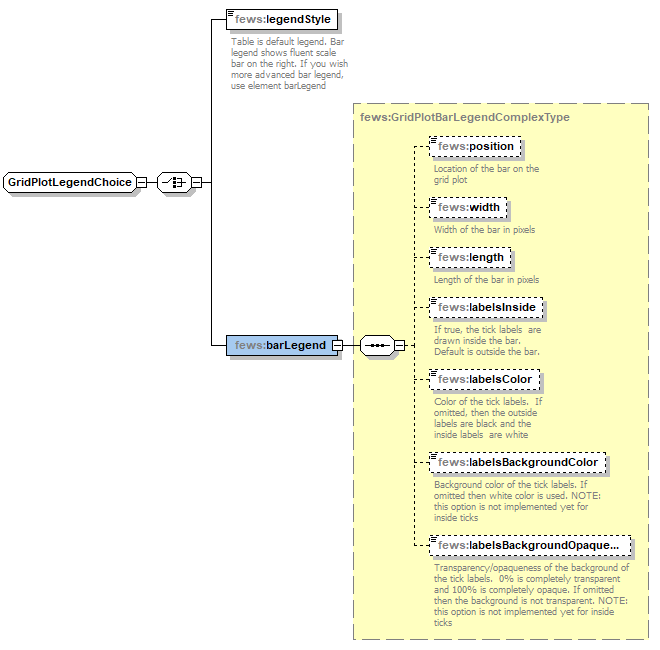
- position: legend can be placed on the right, on the left, at the top or at the bottom. Default is on the right.
- width: width of the bar in pixels. Default is 40 pixels.
- length: length of the bar in pixels. The defaults are 400 pixels for legend on the right/left, and for the legend at the top/bottom the length equals the width of the window.
- labelsInside: if true, ticks and labels are displayed inside the legend bar. By default (false) labels and ticks are placed outside the color bar.
- labelsColor (since 2021.01): color of the tick label texts. If omitted, the outside labels are black and the inside labels are white.
- labelsBackgroundColor (since 2021.01): background color of the tick labels. If omitted, white color is used. Note that this option is not implemented for inside ticks and labels (i.e.: labelsInside=true).
- labelsBackgroundOpaquenessPercentage (since 2021.01): transparency/opaqueness of the background of the tick labels. 0% is completely transparent and 100% is completely opaque. If omitted then the background is not transparent. Note that this option is not implemented for inside ticks and labels (i.e.: labelsInside=true).
- logarithmic (since 2024.01, backported to 2023.01): if true the legend ticks and color breaks are spaced logarithmically.
Elements of the configuration of legend style
...
Definition of colors to use in displaying the dynamic grid. These are also shown in the legend on the left of the grid display (see example elsewhere on this page). Optional when default class breaks are available for this plot group and parameter group.
Figure 145 Elements of the configuration of class breaks
Classbreaks can also be configured in the TimeSeriesDisplayConfig.xml file . If this functionality is used, a reference to the classBreakId is required. When using the Deft-FEWS Web-OC, all classbreaks need to be configured this way otherwise no legend is shown in the WMS layer of the spatial display.
<classBreaksId>rainfall</classBreaksId>
description
Optional description. Since FEWS 2017.01 it is allowed to have multiple class breaks for a plot. The user can switch between the class breaks with a drop down list. This description is used in the drop down list.
...