...
Below are two examples of a config and the resulting plot.
| Code Block |
|---|
| language | xml |
|---|
| title | dual axis example (click to expand) |
|---|
| linenumbers | true |
|---|
| collapse | true |
|---|
| <subplot>
<plotWeight>1</plotWeight>
<line>
<color>blue</color>
<axis>left</axis>
<timeSeriesSet>
<moduleInstanceId>ImportTelemetry</moduleInstanceId>
<valueType>scalar</valueType>
<parameterId>H.obs</parameterId>
<locationId>Hydro1</locationId>
<timeSeriesType>external historical</timeSeriesType>
<timeStep unit="minute" multiplier="15"/>
<relativeViewPeriod unit="hour" start="-36" end="36"/>
<readWriteMode>editing visible to all future task runs</readWriteMode>
</timeSeriesSet>
</line>
<line>
<color>blue</color>
<axis>left</axis>
<timeSeriesSet>
<moduleInstanceId>ImportTelemetry</moduleInstanceId>
<valueType>scalar</valueType>
<parameterId>H.rated</parameterId>
<locationId>Hydro3</locationId>
<timeSeriesType>external historical</timeSeriesType>
<timeStep unit="minute" multiplier="15"/>
<relativeViewPeriod unit="hour" start="-36" end="36"/>
<readWriteMode>editing visible to all future task runs</readWriteMode>
</timeSeriesSet>
</line>
<line>
<color>red</color>
<axis>right</axis>
<timeSeriesSet>
<moduleInstanceId>ImportTelemetry</moduleInstanceId>
<valueType>scalar</valueType>
<parameterId>Q.obs</parameterId>
<locationId>Hydro2</locationId>
<timeSeriesType>external historical</timeSeriesType>
<timeStep unit="minute" multiplier="15"/>
<relativeViewPeriod unit="hour" start="-36" end="36"/>
<readWriteMode>editing visible to all future task runs</readWriteMode>
</timeSeriesSet>
</line>
<line>
<color>red</color>
<axis>right</axis>
<timeSeriesSet>
<moduleInstanceId>ImportTelemetry</moduleInstanceId>
<valueType>scalar</valueType>
<parameterId>Q.rated</parameterId>
<locationId>Hydro4</locationId>
<timeSeriesType>external historical</timeSeriesType>
<timeStep unit="minute" multiplier="15"/>
<relativeViewPeriod unit="hour" start="-36" end="36"/>
<readWriteMode>editing visible to all future task runs</readWriteMode>
</timeSeriesSet>
</line>
</subplot>
|
|  Image Modified Image Modified
|
| Code Block |
|---|
| language | xml |
|---|
| title | dual axis with 2 parameterGroups example (click to expand) |
|---|
| linenumbers | true |
|---|
| collapse | true |
|---|
| <subplot>
<plotWeight>1</plotWeight>
<line>
<color>blue</color>
<axis>right</axis>
<timeSeriesSet>
<moduleInstanceId>ImportTelemetry</moduleInstanceId>
<valueType>scalar</valueType>
<parameterId>H.obs</parameterId>
<locationId>Hydro1</locationId>
<timeSeriesType>external historical</timeSeriesType>
<timeStep unit="minute" multiplier="15"/>
<relativeViewPeriod unit="hour" start="-36" end="36"/>
<readWriteMode>editing visible to all future task runs</readWriteMode>
</timeSeriesSet>
</line>
<line>
<color>red</color>
<timeSeriesSet>
<moduleInstanceId>ImportTelemetry</moduleInstanceId>
<valueType>scalar</valueType>
<parameterId>Q.obs</parameterId>
<locationId>Hydro2</locationId>
<timeSeriesType>external historical</timeSeriesType>
<timeStep unit="minute" multiplier="15"/>
<relativeViewPeriod unit="hour" start="-36" end="36"/>
<readWriteMode>editing visible to all future task runs</readWriteMode>
</timeSeriesSet>
</line>
</subplot>
|
| 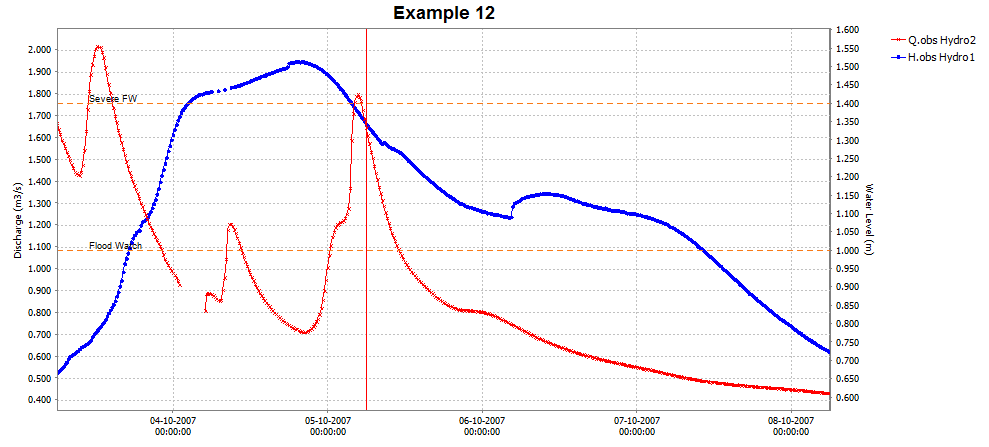 Image Modified Image Modified
Threshold line only for timeseries on the right y axis
|
Stage/discharge plots (dual y-axis plot)
...
Below an configuration and resulting plot
| Code Block |
|---|
| language | xml |
|---|
| title | ratingAxis example (click to expand) |
|---|
| linenumbers | true |
|---|
| collapse | true |
|---|
| <subplot>
<line>
<color>black</color>
<lineStyle>none</lineStyle>
<markerStyle>+</markerStyle>
<markerSize>3</markerSize>
<timeSeriesSet>
<moduleInstanceId>ImportTelemetry</moduleInstanceId>
<valueType>scalar</valueType>
<parameterId>Q.rated</parameterId>
<locationId>Hydro4</locationId>
<timeSeriesType>external historical</timeSeriesType>
<timeStep unit="minute" multiplier="15"/>
<relativeViewPeriod unit="hour" start="-36" end="36"/>
<readWriteMode>editing visible to all future task runs</readWriteMode>
</timeSeriesSet>
</line>
<line>
<color>black</color>
<lineStyle>solid</lineStyle>
<markerStyle>circle</markerStyle>
<markerSize>6</markerSize>
<axis>left</axis>
<ratingAxis>
<parameterGroupId>Water Level</parameterGroupId>
<transformationType>dischargeStage</transformationType>
</ratingAxis>
<timeSeriesSet>
<moduleInstanceId>ImportTelemetry</moduleInstanceId>
<valueType>scalar</valueType>
<parameterId>Q.obs</parameterId>
<locationId>Hydro2</locationId>
<timeSeriesType>external historical</timeSeriesType>
<timeStep unit="minute" multiplier="15"/>
<relativeViewPeriod unit="hour" start="-36" end="36"/>
<readWriteMode>editing visible to all future task runs</readWriteMode>
</timeSeriesSet>
</line>
</subplot>
|
|  Image Modified Image Modified
|
timeSeriesSet
chainageLocationSetId
...
| Code Block |
|---|
| language | xml |
|---|
| title | additionalTimeSeries example (click to expand) |
|---|
| linenumbers | true |
|---|
| collapse | true |
|---|
| <plot id="WATERBALANS_DAG_CAW">
<subplot stackPlot="true">
<lineStyle>bar</lineStyle>
<timeSeriesSet>
<moduleInstanceId>BalansAfvoergebieden</moduleInstanceId>
<valueType>scalar</valueType>
<parameterId>H.G.i.d</parameterId>
<locationSetId>AFVOERGEBIEDEN</locationSetId>
<timeSeriesType>external historical</timeSeriesType>
<timeStep unit="day" timeZone="GMT+1"/>
<relativeViewPeriod unit="day" start="-32" end="0"/>
<readWriteMode>read only</readWriteMode>
</timeSeriesSet>
<additionalTimeSeries name="*AFGB_NAAR*" separateSubPlot="true">
<locationFunctionEquals selected="@LOC_ID@" additional="@AFGB_NAAR@"/>
<timeSeriesSet>
<moduleInstanceId>ImportOpvlWater</moduleInstanceId>
<valueType>scalar</valueType>
<parameterId>Q.G.15</parameterId>
<locationSetId>OPVLWATER_SUBLOC_DEBIETEN</locationSetId>
<timeSeriesType>external historical</timeSeriesType>
<timeStep unit="minute" multiplier="15"/>
<relativeViewPeriod unit="hour" start="-70" end="0"/>
<readWriteMode>read only</readWriteMode>
</timeSeriesSet>
</additionalTimeSeries>
<additionalTimeSeries name="*AFGB_VAN*" separateSubPlot="true">
<locationFunctionEquals selected="@LOC_ID@" additional="@AFGB_VAN@"/>
<timeSeriesSet>
<moduleInstanceId>ImportOpvlWater</moduleInstanceId>
<valueType>scalar</valueType>
<parameterId>Q.G.15</parameterId>
<locationSetId>OPVLWATER_SUBLOC_DEBIETEN</locationSetId>
<timeSeriesType>external historical</timeSeriesType>
<timeStep unit="minute" multiplier="15"/>
<relativeViewPeriod unit="hour" start="-70" end="0"/>
<readWriteMode>read only</readWriteMode>
</timeSeriesSet>
</additionalTimeSeries>
</subplot>
</plot> |
| |
By defining a location loop within a displayGroup, the display group will be created for each location of location set configured in the loop.
...
| Code Block |
|---|
| language | xml |
|---|
| title | locationLoop example (click to expand) |
|---|
| linenumbers | true |
|---|
| collapse | true |
|---|
|
	<displayGroup name="Validations Location Loop">
		<displayGroup name=" ">
			<locationLoop>
				<locationSetId>FloodingAreas</locationSetId>
				<includeChildren>true</includeChildren>
				<locationRelationId>L_AREA</locationRelationId>
				<locationRelationId>L_VISIBILIY</locationRelationId>
				<locationRelationId>MEASUREMENT_PARENT</locationRelationId>
			</locationLoop>
			<displayGroup name="Waterbalance">
				<display name="Waterbalance">
					<plotId>Waterbalance</plotId>
				</display>
				<display name="Waterbalance incl. error">
					<plotId>Waterbalance_error</plotId>
				</display>
			</displayGroup>
                           ...
		</displayGroup>
</displayGroup> |
display (displayGroup)Definition of a pre-configured display. Each display may contain multiple sub-plots. Multiple displays may be defined per display group.
...
- parentLocationId:
- description
- startForwardLookingPeriod: way to define view period for seasonal or water year analysis
- nrOfRecentForecasts: Can be applied to show multiple recent forecasts (simulated forecast type)
- plotId
- tickTimeStep
- thresholdLocationSetId
startForwardLookingPeriod
Normally, displays are defined with a relative view period, so that the view window progresses with current system time. This paradigm does not fit systems that are more oriented towards seasonal or water year analysis. Therefore an option has been added since 2011.02 to define a season, such that the time axis is fixed, while the vertical red line (current system time) moves over time from left to right through the display.
To utilize this functionality, a season should be defined instead of a relative view period. This season specification if composed of a start and end date, as well an entry called 'startForwardLookingPeriod'.
The software compares the currentSystemTime against the date specified in the 'startForwardLookingPeriod' entry, to decide if the time axis needs to shift to the next year/season. This decision is relevant within a water supply forecasting context since a few weeks before the end of the water year you may like to look forward to the next wateryear instead of the current wateryear. Use readWriteMode=read only in your time seriessets, as other modes such as 'read complete forecast' stretches the time horizon, disrupting the time horizon displayed outside the season.
...
| Code Block |
|---|
| language | xml |
|---|
| title | startForwardLookingPeriod example (click to expand) |
|---|
| linenumbers | true |
|---|
| collapse | true |
|---|
| <display name="SELI1 - Selway R nr Lowell - SWE">
<startForwardLookingPeriod>--09-01</startForwardLookingPeriod>
<season>
<startMonthDay>--10-01</startMonthDay>
<endMonthDay>--09-30</endMonthDay>
</season>
<locationId>SELI1L</locationId>
<locationId>SELI1U</locationId>
<plotId>SWE</plotId>
</display>
|
| |
tickTimeStep
To tie the date/time ticks to the valid times of the (cardinal) time step, configure ‘tickTimeStep’ in DisplayGroups.xml. For example, if the ‘tickTimeStep’ is 6 hours then the ticks are always aligned with the synoptic times 00Z, 06Z, 12Z, 18Z. When we are zooming out and there is no space to display all date/times along the x-axis, then one or more synoptic times ticks are omitted. For example we see ticks at 00Z and 18Z.
| Anchor |
|---|
| singleLocationDisplays |
|---|
| singleLocationDisplays |
|---|
|
singleLocationDisplays (displayGroup)Adds multiple displays at once to this display group. Every display will show only one location.
showAsVerticalProfile
When true vertical profile timeseries are calculated on the fly from the scalar time series at the child locations of the locations defined in the timeSeriesSet.
| Code Block |
|---|
| language | xml |
|---|
| title | showAsVerticalProfile example (click to expand) |
|---|
| linenumbers | true |
|---|
| collapse | true |
|---|
| <plot id="waterQuality">
<subplot>
<line>
<color>blue</color>
<lineStyle>solid;thick</lineStyle>
<markerStyle>square</markerStyle>
<timeSeriesSet>
<moduleInstanceId>ProcessObservedWaterquality</moduleInstanceId>
<valueType>scalar</valueType>
<parameterId>WT_obs</parameterId>
<locationId>R_401027</locationId>
<timeSeriesType>external historical</timeSeriesType>
<timeStep unit="hour" multiplier="3"/>
<readWriteMode>read only</readWriteMode>
</timeSeriesSet>
</line>
</subplot>
<subplot>
<line>
<color>turquoise</color>
<lineStyle>solid;thick</lineStyle>
<markerStyle>square</markerStyle>
<timeSeriesSet>
<moduleInstanceId>ProcessObservedWaterquality</moduleInstanceId>
<valueType>scalar</valueType>
<parameterId>EC_obs</parameterId>
<locationId>R_401027</locationId>
<timeSeriesType>external historical</timeSeriesType>
<timeStep unit="hour" multiplier="3"/>
<readWriteMode>read only</readWriteMode>
</timeSeriesSet>
</line>
</subplot>
<subplot>
<line>
<color>cyan</color>
<lineStyle>solid;thick</lineStyle>
<markerStyle>square</markerStyle>
<timeSeriesSet>
<moduleInstanceId>ProcessObservedWaterquality</moduleInstanceId>
<valueType>scalar</valueType>
<parameterId>pH_obs</parameterId>
<locationId>R_401027</locationId>
<timeSeriesType>external historical</timeSeriesType>
<timeStep unit="hour" multiplier="3"/>
<readWriteMode>read only</readWriteMode>
</timeSeriesSet>
</line>
</subplot>
<subplot>
<line>
<color>forest green</color>
<lineStyle>solid;thick</lineStyle>
<markerStyle>square</markerStyle>
<timeSeriesSet>
<moduleInstanceId>ProcessObservedWaterquality</moduleInstanceId>
<valueType>scalar</valueType>
<parameterId>Turbidity_obs</parameterId>
<locationId>R_401027</locationId>
<timeSeriesType>external historical</timeSeriesType>
<timeStep unit="hour" multiplier="3"/>
<readWriteMode>read only</readWriteMode>
</timeSeriesSet>
</line>
</subplot>
<subplot>
<line>
<color>green3</color>
<lineStyle>solid;thick</lineStyle>
<markerStyle>square</markerStyle>
<timeSeriesSet>
<moduleInstanceId>ProcessObservedWaterquality</moduleInstanceId>
<valueType>scalar</valueType>
<parameterId>DO_obs</parameterId>
<locationId>R_401027</locationId>
<timeSeriesType>external historical</timeSeriesType>
<timeStep unit="hour" multiplier="3"/>
<readWriteMode>read only</readWriteMode>
</timeSeriesSet>
</line>
</subplot>
<subplot>
<line>
<color>goldenrod</color>
<lineStyle>solid;thick</lineStyle>
<markerStyle>square</markerStyle>
<timeSeriesSet>
<moduleInstanceId>ProcessObservedWaterquality</moduleInstanceId>
<valueType>scalar</valueType>
<parameterId>DO%_obs</parameterId>
<locationId>R_401027</locationId>
<timeSeriesType>external historical</timeSeriesType>
<timeStep unit="hour" multiplier="3"/>
<readWriteMode>read only</readWriteMode>
</timeSeriesSet>
</line>
</subplot>
</plot>
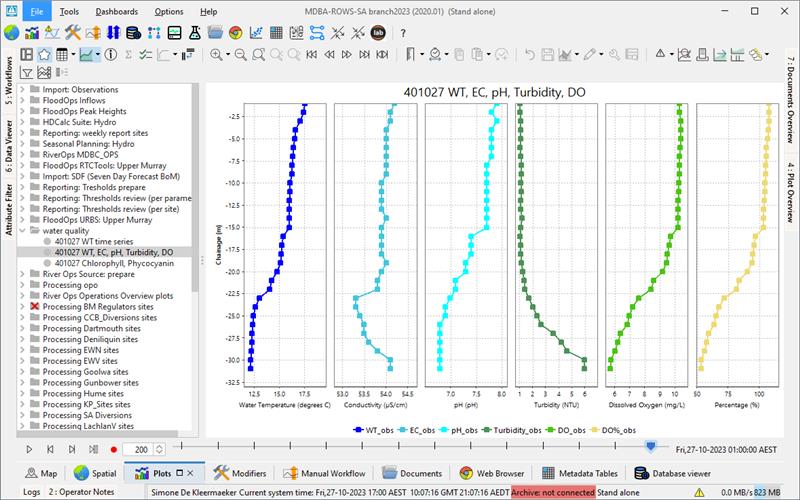
<displayGroup id="waterquality" name="water quality">
<display id="WQ_R_401027" name="401027 WT, EC, pH, Turbidity, DO">
<relativeViewPeriod unit="hour" start="-336" end="168"/>
<locationId>R_401027</locationId>
<plotId>waterQuality</plotId>
<showAsVerticalProfile>true</showAsVerticalProfile>
</display>
</displayGroup>
|
| |
classbreaks or classbreak id
It's possible to configure classbreaks for vertical profile time series. If they are configured, in the time series dropdown menu a "Use color map" button will become visible.
Config example:
| Code Block |
|---|
| language | xml |
|---|
| linenumbers | true |
|---|
|
	<plot id="waterTemperatureVerticalProfile">
		<subplot>
			<line>
				<color>blue</color>
				<lineStyle>solid;thick</lineStyle>
				<markerStyle>square</markerStyle>
				<timeSeriesSet>
					<moduleInstanceId>ProcessObservedWaterquality</moduleInstanceId>
					<valueType>scalar</valueType>
					<parameterId>WT_obs</parameterId>
					<locationId>R_401027</locationId>
					<timeSeriesType>external historical</timeSeriesType>
					<timeStep unit="hour" multiplier="3"/>
					<readWriteMode>read only</readWriteMode>
				</timeSeriesSet>
			</line>
			<classBreaksId>WaterTemperature</classBreaksId>
		</subplot>
		<subplot>
			<line>
				<color>turquoise</color>
				<lineStyle>solid;thick</lineStyle>
				<markerStyle>square</markerStyle>
				<timeSeriesSet>
					<moduleInstanceId>ProcessObservedWaterquality</moduleInstanceId>
					<valueType>scalar</valueType>
					<parameterId>EC_obs</parameterId>
					<locationId>R_401027</locationId>
					<timeSeriesType>external historical</timeSeriesType>
					<timeStep unit="hour" multiplier="3"/>
					<readWriteMode>read only</readWriteMode>
				</timeSeriesSet>
			</line>
			<classBreaks>
				<break lowerValue="2" color="green"/>
				<break lowerValue="3" color="dark sea green"/>
			</classBreaks>
</subplot> |
 Image Added
  Image Added
alwaysDisplayAsColorMap
| Code Block |
|---|
| language | xml |
|---|
| linenumbers | true |
|---|
|
		<display id="WT_R_401027_heatmap" name="401027 WT (heatmap)">
			<relativeViewPeriod unit="hour" start="-336" end="168"/>
			<locationId>R_401027</locationId>
			<plotId>waterQualityHeatmapTemperature</plotId>
			<showAsVerticalProfile>true</showAsVerticalProfile>
			<alwaysDisplayAsColorMap>true</alwaysDisplayAsColorMap>
</display> |
If alwaysDisplayAsColorMap is configured, the subplot will alwys appear as a color map; the option to toggle between vertical profile and color map will be disabled. It can only be used in combination with classbreaks.
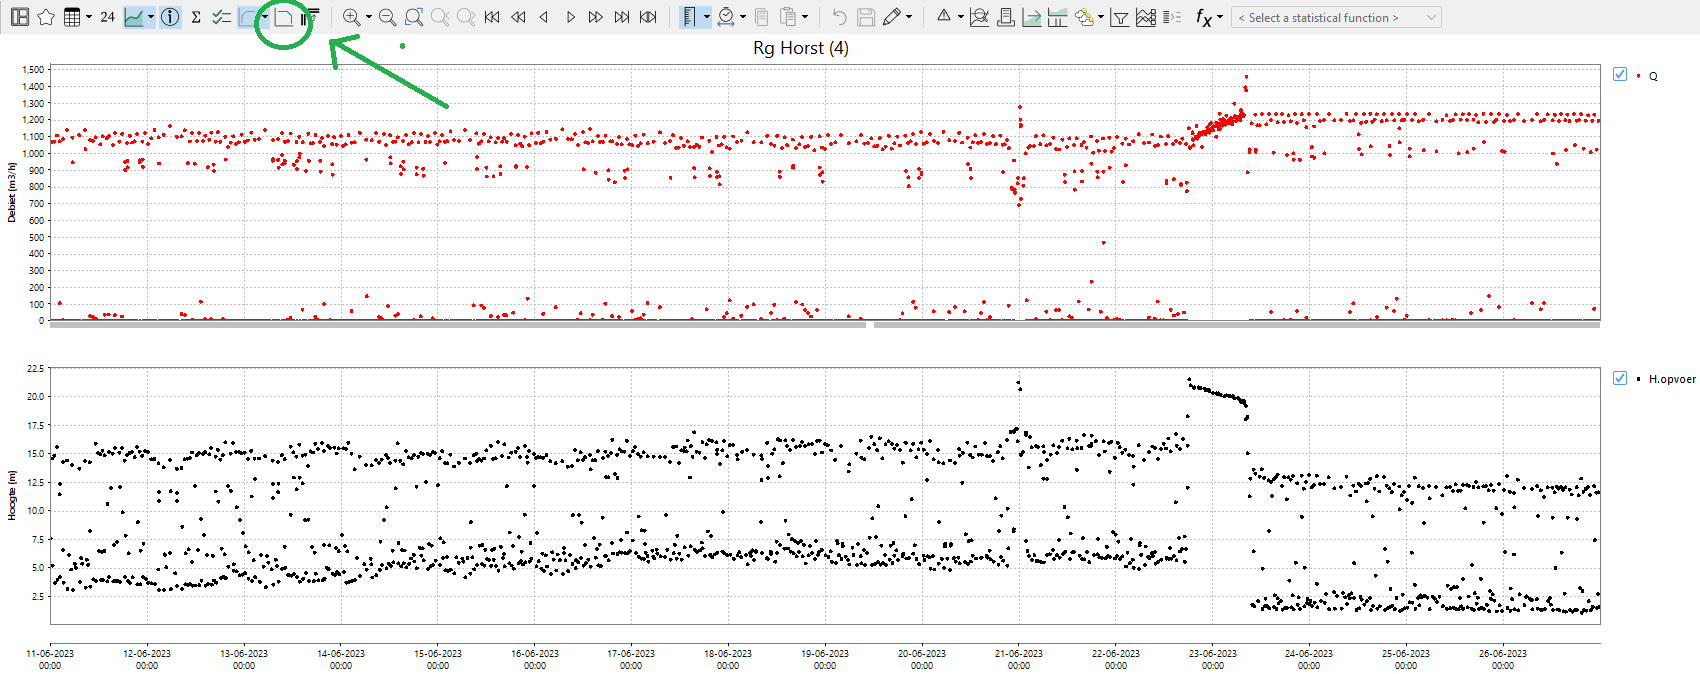
showAsScatterPlot
To plot time series, with the values of the different time series on the X and Y axis. - <referencePoints> can be defined in several ways:
- <point> will be shown as an interaction line.
- <xAttributeId>, <yAttributeId> defining the x and y coordinates of the points, the y-coordinates.
Time dependent location attributes are not supported.
- <interactionLine>
- Any number of interaction lines can be added to the plot.
- Lines configured with points or location attributes can be added in any order or combination.
- You can customise the interaction lines.
In this case, the <referencePoints> element should be surrounded by <interactionLine> element. - None of the customisation options within an <interactionLine> are compulsory.
- With multiple interaction lines, all should be configured as either interactionLine or referencePoints.
You cannot mix <referencePoints> and <interactionLine>
| Example from operational system 
|
...
- <showAsScatterPlot>: TimeSeries display will be replaced with a scatterplot
- <addInteractionScatterPlot>: you can turn on an extra scatterplot that is displayed next to the original time series.. The interaction scatterplot
- This button has to be enabled in the TimeSeriesDisplayConfig.xml buttonSettings
.- with <showInteractionScatterPlot visible="true"/>
With the elements <xAxisRange> and <yAxisRange> the range of the x and y axis can be defined.
Pairing of time series
By default all time series with the same location are paired up, but this behavior can be changed with the following configuration options.
...
| Code Block |
|---|
| language | xml |
|---|
| title | Scatter plot example (click to expand) |
|---|
| linenumbers | true |
|---|
| collapse | true |
|---|
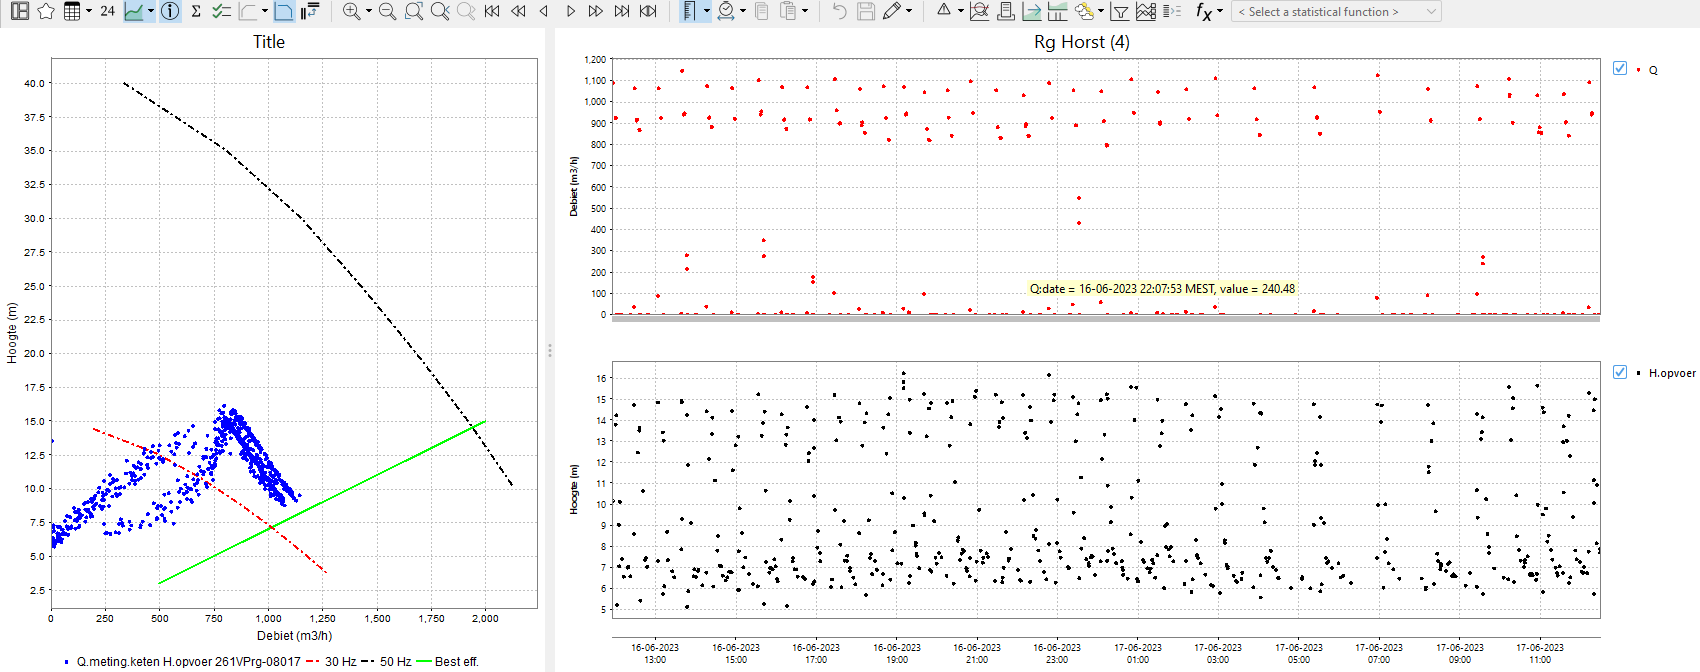
| <displayGroup id="pk" name="Pompkrommes">
<singleParentLocationDisplays>
<locationId>261VPrg-08017</locationId>
<locationId>261VPrg-10021</locationId>
<plotId>pompkromme</plotId>
<addInteractionScatterPlot>
<xAxisParameterId>Q.meting.keten</xAxisParameterId>
<yAxisParameterId>H.opvoer</yAxisParameterId>
<dataLine>
<lineColor>pink</lineColor>
<lineStyle>none</lineStyle>
</dataLine>
<chartTitle>Pompkarakteristieken</chartTitle>
<interactionLine>
<lineColor>red</lineColor>
<lineStyle>solid;thick</lineStyle>
<lineWidth>2</lineWidth>
<labelText>30 Hz</labelText>
<referencePoints>
<xAttributeId>Q_30Hz</xAttributeId>
<yAttributeId>H_30Hz</yAttributeId>
</referencePoints>
</interactionLine>
<interactionLine>
<lineColor>blue</lineColor>
<lineStyle>solid</lineStyle>
<lineWidth>1</lineWidth>
<labelText>samenloop</labelText>
<referencePoints>
<point>
<x>600</x>
<y>5</y>
</point>
<point>
<x>700</x>
<y>4</y>
</point>
<point>
<x>1200</x>
<y>8</y>
</point>
</referencePoints>
</interactionLine>
<referencePointsLegendLabel>Q</referencePointsLegendLabel>
<coloredBackgroundArea>
<label>werkgebied0</label>
<color>green</color>
<opaquenessPercentage>25</opaquenessPercentage>
<point>
<x>600</x>
<y>5</y>
</point>
<point>
<x>700</x>
<y>4</y>
</point>
<point>
<x>1200</x>
<y>8</y>
</point>
</coloredBackgroundArea>
<coloredBackgroundArea>
<label>werkgebied1</label>
<color>green1</color>
<opaquenessPercentage>10</opaquenessPercentage>
<xAttributeId>enkelloop_Q</xAttributeId>
<yAttributeId>enkelloop_H</yAttributeId>
</coloredBackgroundArea>
<overrulingSeriesLabel>QH</overrulingSeriesLabel>
<markerVisibility>all</markerVisibility>
</addInteractionScatterPlot>
</singleParentLocationDisplays>
</displayGroup> |
| |
statisticalFunctionId
(since 2021.02) Using statisticalFunctionId it is possible to create a preconfigured display with any statistical function.
...