...
Below are two examples of a config and the resulting plot.
| Code Block |
|---|
| language | xml |
|---|
| title | dual axis example (click to expand) |
|---|
| linenumbers | true |
|---|
| collapse | true |
|---|
| <subplot>
<plotWeight>1</plotWeight>
<line>
<color>blue</color>
<axis>left</axis>
<timeSeriesSet>
<moduleInstanceId>ImportTelemetry</moduleInstanceId>
<valueType>scalar</valueType>
<parameterId>H.obs</parameterId>
<locationId>Hydro1</locationId>
<timeSeriesType>external historical</timeSeriesType>
<timeStep unit="minute" multiplier="15"/>
<relativeViewPeriod unit="hour" start="-36" end="36"/>
<readWriteMode>editing visible to all future task runs</readWriteMode>
</timeSeriesSet>
</line>
<line>
<color>blue</color>
<axis>left</axis>
<timeSeriesSet>
<moduleInstanceId>ImportTelemetry</moduleInstanceId>
<valueType>scalar</valueType>
<parameterId>H.rated</parameterId>
<locationId>Hydro3</locationId>
<timeSeriesType>external historical</timeSeriesType>
<timeStep unit="minute" multiplier="15"/>
<relativeViewPeriod unit="hour" start="-36" end="36"/>
<readWriteMode>editing visible to all future task runs</readWriteMode>
</timeSeriesSet>
</line>
<line>
<color>red</color>
<axis>right</axis>
<timeSeriesSet>
<moduleInstanceId>ImportTelemetry</moduleInstanceId>
<valueType>scalar</valueType>
<parameterId>Q.obs</parameterId>
<locationId>Hydro2</locationId>
<timeSeriesType>external historical</timeSeriesType>
<timeStep unit="minute" multiplier="15"/>
<relativeViewPeriod unit="hour" start="-36" end="36"/>
<readWriteMode>editing visible to all future task runs</readWriteMode>
</timeSeriesSet>
</line>
<line>
<color>red</color>
<axis>right</axis>
<timeSeriesSet>
<moduleInstanceId>ImportTelemetry</moduleInstanceId>
<valueType>scalar</valueType>
<parameterId>Q.rated</parameterId>
<locationId>Hydro4</locationId>
<timeSeriesType>external historical</timeSeriesType>
<timeStep unit="minute" multiplier="15"/>
<relativeViewPeriod unit="hour" start="-36" end="36"/>
<readWriteMode>editing visible to all future task runs</readWriteMode>
</timeSeriesSet>
</line>
</subplot>
|
|  Image Modified Image Modified
|
| Code Block |
|---|
| language | xml |
|---|
| title | dual axis with 2 parameterGroups example (click to expand) |
|---|
| linenumbers | true |
|---|
| collapse | true |
|---|
| <subplot>
<plotWeight>1</plotWeight>
<line>
<color>blue</color>
<axis>right</axis>
<timeSeriesSet>
<moduleInstanceId>ImportTelemetry</moduleInstanceId>
<valueType>scalar</valueType>
<parameterId>H.obs</parameterId>
<locationId>Hydro1</locationId>
<timeSeriesType>external historical</timeSeriesType>
<timeStep unit="minute" multiplier="15"/>
<relativeViewPeriod unit="hour" start="-36" end="36"/>
<readWriteMode>editing visible to all future task runs</readWriteMode>
</timeSeriesSet>
</line>
<line>
<color>red</color>
<timeSeriesSet>
<moduleInstanceId>ImportTelemetry</moduleInstanceId>
<valueType>scalar</valueType>
<parameterId>Q.obs</parameterId>
<locationId>Hydro2</locationId>
<timeSeriesType>external historical</timeSeriesType>
<timeStep unit="minute" multiplier="15"/>
<relativeViewPeriod unit="hour" start="-36" end="36"/>
<readWriteMode>editing visible to all future task runs</readWriteMode>
</timeSeriesSet>
</line>
</subplot>
|
| 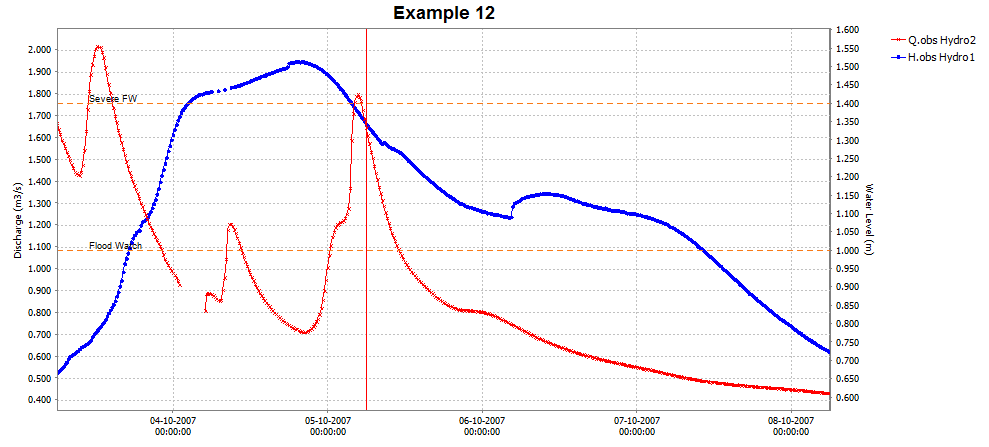 Image Modified Image Modified
Threshold line only for timeseries on the right y axis
|
Stage/discharge plots (dual y-axis plot)
...
Below an configuration and resulting plot
| Code Block |
|---|
| language | xml |
|---|
| title | ratingAxis example (click to expand) |
|---|
| linenumbers | true |
|---|
| collapse | true |
|---|
| <subplot>
<line>
<color>black</color>
<lineStyle>none</lineStyle>
<markerStyle>+</markerStyle>
<markerSize>3</markerSize>
<timeSeriesSet>
<moduleInstanceId>ImportTelemetry</moduleInstanceId>
<valueType>scalar</valueType>
<parameterId>Q.rated</parameterId>
<locationId>Hydro4</locationId>
<timeSeriesType>external historical</timeSeriesType>
<timeStep unit="minute" multiplier="15"/>
<relativeViewPeriod unit="hour" start="-36" end="36"/>
<readWriteMode>editing visible to all future task runs</readWriteMode>
</timeSeriesSet>
</line>
<line>
<color>black</color>
<lineStyle>solid</lineStyle>
<markerStyle>circle</markerStyle>
<markerSize>6</markerSize>
<axis>left</axis>
<ratingAxis>
<parameterGroupId>Water Level</parameterGroupId>
<transformationType>dischargeStage</transformationType>
</ratingAxis>
<timeSeriesSet>
<moduleInstanceId>ImportTelemetry</moduleInstanceId>
<valueType>scalar</valueType>
<parameterId>Q.obs</parameterId>
<locationId>Hydro2</locationId>
<timeSeriesType>external historical</timeSeriesType>
<timeStep unit="minute" multiplier="15"/>
<relativeViewPeriod unit="hour" start="-36" end="36"/>
<readWriteMode>editing visible to all future task runs</readWriteMode>
</timeSeriesSet>
</line>
</subplot>
|
|  Image Modified Image Modified
|
timeSeriesSet
chainageLocationSetId
...
| Code Block |
|---|
| language | xml |
|---|
| title | showAsVerticalProfile example (click to expand) |
|---|
| linenumbers | true |
|---|
| collapse | true |
|---|
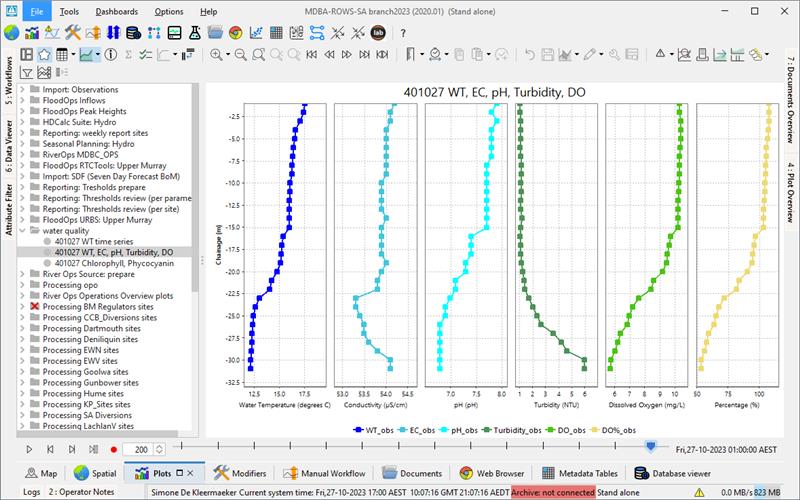
| <plot id="waterQuality">
<subplot>
<line>
<color>blue</color>
<lineStyle>solid;thick</lineStyle>
<markerStyle>square</markerStyle>
<timeSeriesSet>
<moduleInstanceId>ProcessObservedWaterquality</moduleInstanceId>
<valueType>scalar</valueType>
<parameterId>WT_obs</parameterId>
<locationId>R_401027</locationId>
<timeSeriesType>external historical</timeSeriesType>
<timeStep unit="hour" multiplier="3"/>
<readWriteMode>read only</readWriteMode>
</timeSeriesSet>
</line>
</subplot>
<subplot>
<line>
<color>turquoise</color>
<lineStyle>solid;thick</lineStyle>
<markerStyle>square</markerStyle>
<timeSeriesSet>
<moduleInstanceId>ProcessObservedWaterquality</moduleInstanceId>
<valueType>scalar</valueType>
<parameterId>EC_obs</parameterId>
<locationId>R_401027</locationId>
<timeSeriesType>external historical</timeSeriesType>
<timeStep unit="hour" multiplier="3"/>
<readWriteMode>read only</readWriteMode>
</timeSeriesSet>
</line>
</subplot>
<subplot>
<line>
<color>cyan</color>
<lineStyle>solid;thick</lineStyle>
<markerStyle>square</markerStyle>
<timeSeriesSet>
<moduleInstanceId>ProcessObservedWaterquality</moduleInstanceId>
<valueType>scalar</valueType>
<parameterId>pH_obs</parameterId>
<locationId>R_401027</locationId>
<timeSeriesType>external historical</timeSeriesType>
<timeStep unit="hour" multiplier="3"/>
<readWriteMode>read only</readWriteMode>
</timeSeriesSet>
</line>
</subplot>
<subplot>
<line>
<color>forest green</color>
<lineStyle>solid;thick</lineStyle>
<markerStyle>square</markerStyle>
<timeSeriesSet>
<moduleInstanceId>ProcessObservedWaterquality</moduleInstanceId>
<valueType>scalar</valueType>
<parameterId>Turbidity_obs</parameterId>
<locationId>R_401027</locationId>
<timeSeriesType>external historical</timeSeriesType>
<timeStep unit="hour" multiplier="3"/>
<readWriteMode>read only</readWriteMode>
</timeSeriesSet>
</line>
</subplot>
<subplot>
<line>
<color>green3</color>
<lineStyle>solid;thick</lineStyle>
<markerStyle>square</markerStyle>
<timeSeriesSet>
<moduleInstanceId>ProcessObservedWaterquality</moduleInstanceId>
<valueType>scalar</valueType>
<parameterId>DO_obs</parameterId>
<locationId>R_401027</locationId>
<timeSeriesType>external historical</timeSeriesType>
<timeStep unit="hour" multiplier="3"/>
<readWriteMode>read only</readWriteMode>
</timeSeriesSet>
</line>
</subplot>
<subplot>
<line>
<color>goldenrod</color>
<lineStyle>solid;thick</lineStyle>
<markerStyle>square</markerStyle>
<timeSeriesSet>
<moduleInstanceId>ProcessObservedWaterquality</moduleInstanceId>
<valueType>scalar</valueType>
<parameterId>DO%_obs</parameterId>
<locationId>R_401027</locationId>
<timeSeriesType>external historical</timeSeriesType>
<timeStep unit="hour" multiplier="3"/>
<readWriteMode>read only</readWriteMode>
</timeSeriesSet>
</line>
</subplot>
</plot>
<displayGroup id="waterquality" name="water quality">
<display id="WQ_R_401027" name="401027 WT, EC, pH, Turbidity, DO">
<relativeViewPeriod unit="hour" start="-336" end="168"/>
<locationId>R_401027</locationId>
<plotId>waterQuality</plotId>
<showAsVerticalProfile>true</showAsVerticalProfile>
</display>
</displayGroup>
|
| |
classbreaks or classbreak id
It's possible to configure classbreaks for vertical profile time series. If they are configured, in the time series dropdown menu a "Use color map" button will become visible.
Config example:
| Code Block |
|---|
| language | xml |
|---|
| linenumbers | true |
|---|
|
	<plot id="waterTemperatureVerticalProfile">
		<subplot>
			<line>
				<color>blue</color>
				<lineStyle>solid;thick</lineStyle>
				<markerStyle>square</markerStyle>
				<timeSeriesSet>
					<moduleInstanceId>ProcessObservedWaterquality</moduleInstanceId>
					<valueType>scalar</valueType>
					<parameterId>WT_obs</parameterId>
					<locationId>R_401027</locationId>
					<timeSeriesType>external historical</timeSeriesType>
					<timeStep unit="hour" multiplier="3"/>
					<readWriteMode>read only</readWriteMode>
				</timeSeriesSet>
			</line>
			<classBreaksId>WaterTemperature</classBreaksId>
		</subplot>
		<subplot>
			<line>
				<color>turquoise</color>
				<lineStyle>solid;thick</lineStyle>
				<markerStyle>square</markerStyle>
				<timeSeriesSet>
					<moduleInstanceId>ProcessObservedWaterquality</moduleInstanceId>
					<valueType>scalar</valueType>
					<parameterId>EC_obs</parameterId>
					<locationId>R_401027</locationId>
					<timeSeriesType>external historical</timeSeriesType>
					<timeStep unit="hour" multiplier="3"/>
					<readWriteMode>read only</readWriteMode>
				</timeSeriesSet>
			</line>
			<classBreaks>
				<break lowerValue="2" color="green"/>
				<break lowerValue="3" color="dark sea green"/>
			</classBreaks>
</subplot> |
 Image Added
  Image Added
alwaysDisplayAsColorMap
| Code Block |
|---|
| language | xml |
|---|
| linenumbers | true |
|---|
|
		<display id="WT_R_401027_heatmap" name="401027 WT (heatmap)">
			<relativeViewPeriod unit="hour" start="-336" end="168"/>
			<locationId>R_401027</locationId>
			<plotId>waterQualityHeatmapTemperature</plotId>
			<showAsVerticalProfile>true</showAsVerticalProfile>
			<alwaysDisplayAsColorMap>true</alwaysDisplayAsColorMap>
</display> |
If alwaysDisplayAsColorMap is configured, the subplot will alwys appear as a color map; the option to toggle between vertical profile and color map will be disabled. It can only be used in combination with classbreaks.
showAsScatterPlot
To plot time series, with the values of the different time series on the X and Y axis. - <referencePoints> can be defined in several ways:
- <point> will be shown as an interaction line.
- <xAttributeId>, <yAttributeId> defining the x and y coordinates of the points, the y-coordinates.
Time dependent location attributes are not supported.
- <interactionLine>
- Any number of interaction lines can be added to the plot.
- Lines configured with points or location attributes can be added in any order or combination.
- You can customise the interaction lines.
In this case, the <referencePoints> element should be surrounded by <interactionLine> element. - None of the customisation options within an <interactionLine> are compulsory.
- With multiple interaction lines, all should be configured as either interactionLine or referencePoints.
You cannot mix <referencePoints> and <interactionLine>
| Example from operational system 
|
...
- <showAsScatterPlot>: TimeSeries display will be replaced with a scatterplot
- <addInteractionScatterPlot>: you can turn on an extra scatterplot that is displayed next to the original time series.. The interaction scatterplot
- This button has to be enabled in the TimeSeriesDisplayConfig.xml buttonSettings
.- with <showInteractionScatterPlot visible="true"/>
With the elements <xAxisRange> and <yAxisRange> the range of the x and y axis can be defined.
...