...
In the Standalone mode the System Monitor will display the Log Browser, Forecaster Notes, Batch Forecast tab, Import status and since 2021.02 also Running forecasts. On overview of the tabs available in the System Monitor of a Standalone system is illustrated below.


In an Operator Client the System Monitor will show a number of tabs for monitoring various aspects of the live system. On overview of the tabs available in an Operator Client when logged into a live system is illustrated below.


Each of the System Monitor tabs is detailed in the following paragraphs.
| Anchor | ||||
|---|---|---|---|---|
|
...
With [Refresh] the browser is updated with new messages in the system. Please note that the query settings (see below) define what messages will be displayed. With [Close], a user can leave the Log Browser.


Upon opening, the same information is displayed as in the Log Viewer. Per message, the Log Browser provides the following information:
...
Double click a message to view the message details (see example below). The message can then be saved to file or printed.

Query definition
A query can be defined to select a subset of the messages to be displayed in the Log Browser. The following options are available:
...
The display will be updated on the basis of the user defined query upon pressing [Refresh].
Acknowledging messages

All messages having a level ERROR or FATAL should be acknowledged to identify that the message has been seen and appropriate action taken.
...
- Currently dispatched forecasts (taskruns)
- Currently executing forecasts (taskruns)
- Status of the Master Controllers
- Status of the Forecasting ShellsShells
The status lists show the currently configured master controllers and forecasting shells. From this list a user can see if the systems are Alive or if they are down.

Scheduled Forecasts
The Scheduled Forecasts tab includes a list with all scheduled forecasts together with some information of these forecasts. The following information is included:
...
Since 2021.02 this tab is also added to SA and it has 2 a new columnscolumn:
- Activity progress: this shows the progress of the activity current module instance that is running, this will only show a number higher than 0 when execute activities in the general adapter either read the progress from the console of the executable and / or have <activityDurationWeight> configured. See the the console element of the general adapter.
- Workflow Node Index: this shows which part of the workflow is currently being executed. Via right mouse "show in workflow navigator" the workflow and its steps can be inspected. This way the user can track which part of the workflow is currently being exectuted.
If the option <updateModuleRunTimesOnCompletion> is configured in the ModuleInstanceDescriptors.xml , Fews will register the last duration of the run. This information is then used to estimate the expected completion time, the next time you run this workflow. To see these estimates at the module level in the bottom table, one needs to select the task in the top table of the Running Forecast tab. Note that the progress of the module (at the bottom) is an estimate based on previous runs, while the Task progress at the top is typically based on actual progress reported by the General Adapter.


A manually dispatched task can be killed by pressing on the 'Kill Running Task' button. Note that this is a hard process kill which may lead to corruption of the local datastore.
...
- Activity: identifies the synchronisation activity
- Type: single or continuous. A single type activity is only started after certain manual actions
- Frequency: only applicable for continuous synchronisation activities. The frequency is given in minutes.
- Last Synch Time: the date and time the synchronisation activity has last taken place.
- Status: is either empty or shows 'synchronising', meaning that this activity is now synchronising.
- Progress: shows the number of records of the maximum number of records to synchronise. This field is only used for the activity being synchronised.

Synchronisation Monitor
In the Synchronisation Monitor tab the log messages are shown that are generated by the synchronisation module. These messages will inform the user of synchronisation problems.


Import Status
The Import Status tab provides information on the files that were last imported. For each import task the file name of the last imported file is shown including the date and time of the import. Also the number of files that were imported in that task are shown, with the number of failed imports.
By default all data feeds are visible in the Import Status tab. If some data feeds are not wanted, for example because they are not really relevant, one can use an option disableDataFeedInfo in the TimeSeriesImport config file. Since 2019.02 obsolete data feeds can be deleted from the admin interface. See Admin Interface Files - Import Status. 
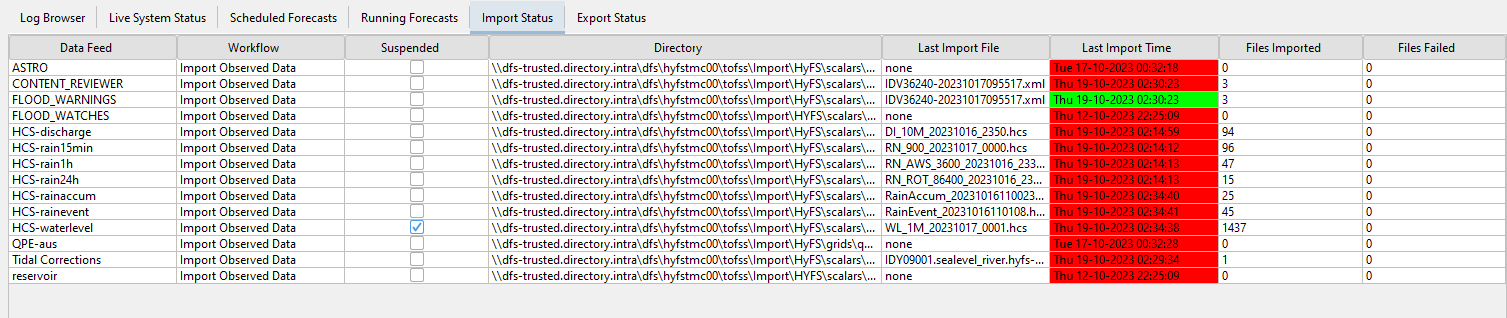
Last import time is updated only if at least one file has been successfully imported. The cell in the column ‘Files Failed’ is colored red when there is one or more files failed.
...
Last import time stays red if the time series has been never imported for that data feed. The picture below illustrates this. There is no time series imported from Q_m.xml, because the wanted time series were not available in the file. There is also no time series imported for Level measured, since the import folder was empty.

Export Status
The Export Status tab provides information on the files that were last exported. For each export task the file name of the last exported file is shown including the date and time of the export. Also the number of files that were exported in that task are shown, with the number of failed exports.
By default all data feeds are visible in the Export Status tab. If some data feeds are not wanted, for example because they are not really relevant, one can use an option disableDataFeedInfo in the TimeSeriesImport config file. See Files - Export Status.

Last export time is updated only if at least one file has been successfully exported. The cell in the column ‘Files Failed Count’ is colored red when there is one or more files failed.