...
The first step for installation is to obtain the program. It can be downloaded by pressing the right mouse key on 'download'. Installation is straight forward.
...
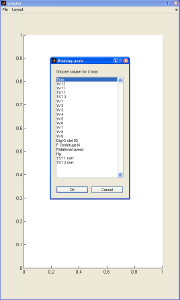
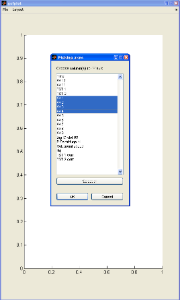
Now you have to choose which quantities you are going to plot. To make this choise easier, two dialogs will popup subsequently, the first allows you to choose which the quantity should be drawn along the horizontal (X) axis, the second dialog allows you to choose the quantity or quantities which should be drawn along the vertical (Y) axis. As soon as you have made your choise, a graph will be drawn in the current window. If you select more than one quantity along the Y axis, a small legend window is automatically generated. The legend window is positioned by default in the right top corner. The user can drag it to any position within the axes.


Options
1) Orientation
You can change the orientation from portrait to landscape and visa versa. Click on Layout → Orientation.
A dialog will popup. You may either choose portrait or landscape.


2) Zoom in
Maybe not all of your graph is interesting. Therefore you may like to zoom in on your data. Click on Layout → Zoom → Zoom in.
...