Here is the documention documentation of Nourishments dataset. The whole dataset is available in nc format and as kml/kmz file.
Nourishment data in OpenEarth:
The dataset of nourishments along the Dutch coast is available from 1952 until today (end 2015) here. nourishments.nc has two different data structures:
1-Dimensional arrays based on the list of nourishments along the Dutch coast, as provided by Rijkswaterstaat
n_code (<String>)
date ( <Float64>) stretch ( <Float64>) kustvak (<String>) location (<String>)
... type (<String>) vol (<Float64>) vol_per_metre (<Float64>) [nourishment = 409] [nourishment = 409][bounds = 2] [nourishment = 409][bounds = 2] [nourishment = 409] [nourishment = 409] [nourishment = 409] [nourishment = 409] [nourishment = 409] 3-Dimensional matrices based on transects, time and type. From the original list of nourishment types, four types have been defined which represent the original list:
Beach Shoreface Dune Other strandsuppletie, strandsuppletie banket, strandsuppletie+vooroever, banket, strand (zwakke sch.), strand-duinsuppletie, strandsuppletie+duinverzwaring onderwatersuppletie, vooroever, vooroeversuppletie, geulwand, geulwandsuppletie duin, duinverzwaring, landwaartse duinverzwaring, zeewaartse duinverzwaring, dijkverzwaring, duinverzwaring en strandsuppletie, zeewaartse duinverzwaring en strandsuppletie OTHER The data structure is similar to the JarKus dataset concerning the alongshore dimension, although it contains data from 1952 until now and it distinguishes among the fore-mentioned four main nourishment types.
Volume ( <Float64>)
Time_start ( <Float64>) Time_end ( <Float64>) [alongshore = 2268][n_time = 64][type_flag = 4] [alongshore = 2268][n_time = 64][type_flag = 4] [alongshore = 2268][n_time = 64][type_flag = 4] 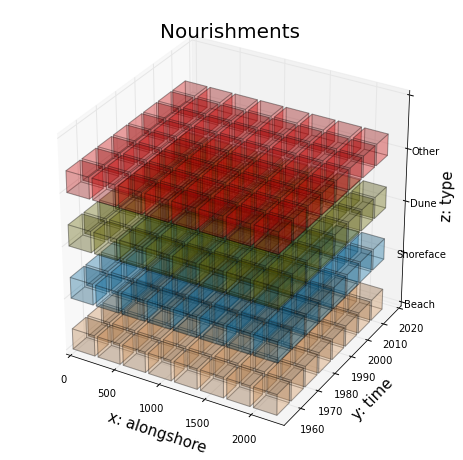
Nourishment visualization in Google Earth:
A Google Earth kml/kmz file is created with Python scripts and moved here. Volume, volume per alongshore distance, nourishment type, period and kustvak are presented in the visualization..

Data flow
Data flow is summarized as:
- Raw data + scripts (ascii + Python)
- Raw ascii data + Python tools for conversion to netCDF
https://svn.oss.deltares.nl/repos/openearthrawdata/trunk/rijkswaterstaat/suppleties/scripts/ (register at oss.deltares.nl)
- Raw ascii data + Python tools for conversion to netCDF
- Standardized data (netCDF on OPeNDAP)
- Visualized data (kml)
TODO: Better compliancy with CF
See also: