...
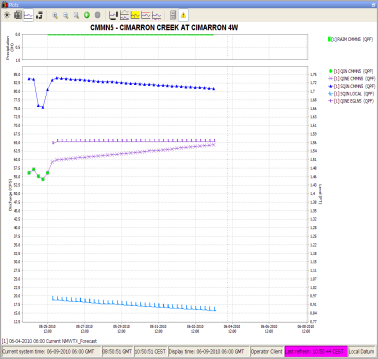
The plot display is used to show scalar time series. Each node has its own set of predefined displays configured. When a node is selected the plots display automatically updates the plots which are already displayed to show data for the new node. The first plot configured for the selected node is automatically shown in this display.
When the IFD is started, there is always at least one plot display available. This plot is called the primary plot display. The primary plot doesn't have lock icon at the left of the toolbar. When a new plot display is started this plot will have a lock icon at the left on the toolbar. When a new plot displayed is started, by default the plot will be locked.

When a plot is locked, the display is locked to that set of time series. When the forecaster moves from basin to basin, the plot will continue to display the original timeseries. The plot is not updated. However, as new data is brought in, the plot is updated with new data.
When the toggle-button is switched off (icon changes to unlock) the plot window is updated automatically when a new node is selected.
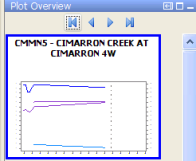
Plot overview
The plot overview is a panel which shows a thumbnail of each plot which is configured for the selected node. This panel gives an overview of the selected node. When a plot is selected the primary plot is automatically updated, also other plots display which are not locked (see previous chapter) are updated. Primary plot is defined by including the following task in the explorer tasks: nl.wldelft.fews.gui.plugin.timeseries.PlotsTimeSeriesDialog. Is such task is not defined the Plot Overview works only if a time series dialog window is open.

At the top of the panel there are four buttons. The first button selects the first plot, the second button selects the previous plot, the third button selects the next plot and the last button selects the last plot.
...
The modifier display can be started by clicking on the wrench-icon at the toolbar or by using the shortcut ctrl+m. The modifier display will show all the mods which are applied in the currently selected segment. By clicking on the create mod-button a new mod can be created. After pressing the create mod-button a list of available mods will be shown. When the mod is created it can be applied by pressing the apply-button. With the run-buttons (rerun, rerun to selected and rerun all to selected) it is possible to rerun the workflows. Pressing the run-buttons will also automatically apply the mod.
Continue with the forecast process downstream
...
By default FEWS will start with the map display opened in the centre section of the display and with the map display, data display and the topology display docked in the centre center section of FEWS. It is possible to customize the display layout. First step in customizing the display layout is to manually place the display in the desired display layout. In the example below three displays are undocked and the graph-tab and the display are moved to the left section of the display. In the File-menu the user can store this layout by selecting the option store layout. The next time FEWS is started it will start with the stored layout.

Save display layout and reload default layout
...