...
Below a screenshot of a variable line width plot for different ensemble members that have different line width's. In this case line width is an indication of the probability of the ensemble member. The sum of probability of all ensemble members at a time is one. Selecting separate ensemble members will mark them with the color black.
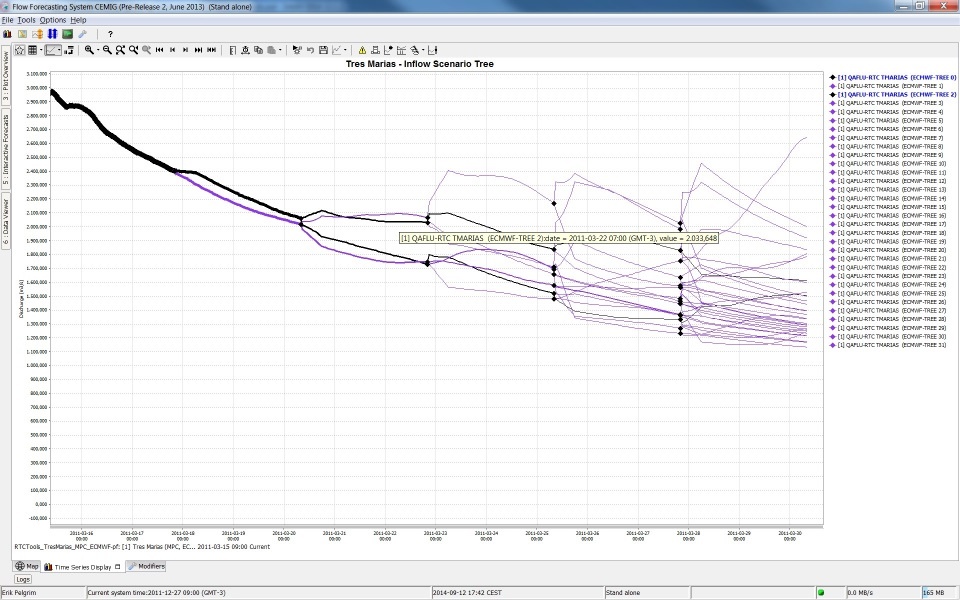
Configuration used for above example
| Code Block | ||||||
|---|---|---|---|---|---|---|
| ||||||
	<displayGroup name="Scenario Tree Test">
		<display name="Tres Marias - Inflow Scenario Tree">
			<subplot>
				<variableLineWidth>
					<color>purple</color>
					<lineStyle>solid</lineStyle>
					<markerStyle>diamond</markerStyle>
					<markerSize>10</markerSize>
					<markerColor>black</markerColor>
					<lineWidthScaleFactor>10</lineWidthScaleFactor>
					<valueTimeSeriesSet>
						<moduleInstanceId>RTCTools_TresMarias_MPC_ECMWF-pf</moduleInstanceId>
						<valueType>scalar</valueType>
						<parameterId>QAFLU-RTC</parameterId>
						<locationId>TMARIAS</locationId>
						<timeSeriesType>simulated forecasting</timeSeriesType>
						<timeStep unit="hour" multiplier="1"/>
						<readWriteMode>read complete forecast</readWriteMode>
						<ensembleId>ECMWF-TREE</ensembleId>
					</valueTimeSeriesSet>
					<lineWidthTimeSeriesSet>
						<moduleInstanceId>RTCTools_TresMarias_MPC_ECMWF-pf</moduleInstanceId>
						<valueType>scalar</valueType>
						<parameterId>Probability</parameterId>
						<locationId>Probability</locationId>
						<timeSeriesType>simulated forecasting</timeSeriesType>
						<timeStep unit="hour" multiplier="1"/>
						<readWriteMode>read complete forecast</readWriteMode>
						<ensembleId>ECMWF-TREE</ensembleId>
					</lineWidthTimeSeriesSet>
				</variableLineWidth>
			</subplot>
		</display>
</displayGroup> |
singleLocationDisplays
Single location displays can be used to easily create plots for individual locations. This can either be done for individual locations, or alternatively for a locationSet which will then produce a list of location with their corresponding plot.
| Code Block | ||||||
|---|---|---|---|---|---|---|
| ||||||
<displayGroups version="1.0" xmlns="http://www.wldelft.nl/fews" xmlns:xsi="http://www.w3.org/2001/XMLSchema-instance" xsi:schemaLocation="http://www.wldelft.nl/fews http://fews.wldelft.nl/schemas/version1.0/displayGroups.xsd">
	<plot id="MW_Observed">
		<subplot>
			<timeSeriesSet>
				<moduleInstanceId>ImportObserved</moduleInstanceId>
				<valueType>scalar</valueType>
				<parameterId>H.obs</parameterId>
				<locationSetId>MW_Stations</locationSetId>
				<timeSeriesType>external historical</timeSeriesType>
				<timeStep unit="nonequidistant"/>
				<relativeViewPeriod unit="day" start="-2" end="0"/>
				<readWriteMode>add originals</readWriteMode>
			</timeSeriesSet>
		</subplot>
	</plot>
	<displayGroup name="Rain gauges single location display">
		<displayGroup name="Single location display">
			<singleLocationDisplays>
				<locationSetId>MW_Stations</locationSetId>
				<plotId>MW_Observed</plotId>
			</singleLocationDisplays>
		</displayGroup>
	</displayGroup>
</displayGroups> |
locationLoop
Since 2015.01 it is now possible to create a whole tree of display groups for each location in a location set. This is for site where there are a multiple subplots required for each location (including child locations, parameters etc).
| Code Block | ||||||
|---|---|---|---|---|---|---|
| ||||||
<displayGroups version="1.0" xmlns="http://www.wldelft.nl/fews" xmlns:xsi="http://www.w3.org/2001/XMLSchema-instance" xsi:schemaLocation="http://www.wldelft.nl/fews http://fews.wldelft.nl/schemas/version1.0/displayGroups.xsd">
	<plot id="MW_Observed">
		<subplot>
			<timeSeriesSet>
				<moduleInstanceId>ImportObserved</moduleInstanceId>
				<valueType>scalar</valueType>
				<parameterId>H.obs</parameterId>
				<locationSetId>MW_Stations</locationSetId>
				<timeSeriesType>external historical</timeSeriesType>
				<timeStep unit="nonequidistant"/>
				<relativeViewPeriod unit="day" start="-2" end="0"/>
				<readWriteMode>add originals</readWriteMode>
			</timeSeriesSet>
		</subplot>
	</plot>
	<displayGroup name="Rain gauges location loop">
		<displayGroup name="Loop display">
			<locationLoop>
				<locationSetId>MW_Stations</locationSetId>
				<includeChildren>true</includeChildren>
			</locationLoop>
			<display name="Observed">
				<plotId>MW_Observed</plotId>
			</display>
		</displayGroup>
	</displayGroup>
</displayGroups> |
Single location displays can be used to easily create plots for individual locations. This can either be done for individual locations, or alternatively for a locationSet which will then produce a list of location with their corresponding plot.Chainage location set
(Since 2016.02) By using a chainage location set in a time series set of a plot in the display groups, a longitudinal profile can be plot based on scalar time series for different locations
| Code Block | ||||||
|---|---|---|---|---|---|---|
| ||||||
<displayGroups version="1.0" xmlns="http://www.wldelft.nl/fews" xmlns:xsi="http://www.w3.org/2001/XMLSchema-instance" xsi:schemaLocation="http://www.wldelft.nl/fews http://fews.wldelft.nl/schemas/version1.0/displayGroups.xsd">
	<plot id="Langsprofiel_Caspargouwse_Wetering">
		<subplot>
			<timeSeriesSet>
				<moduleInstanceId>WerkFilter</moduleInstanceId>
				<valueType>scalar</valueType>
				<parameterId>H.G.15</parameterId>
				<chainageLocationSetId>Langsprofiel_Caspargouwse_Wetering</chainageLocationSetId>
				<timeSeriesType>external historical</timeSeriesType>
				<timeStep unit="minute" multiplier="15"/>
				<relativeViewPeriod unit="day" start="-32" end="0"/>
				<readWriteMode>read only</readWriteMode>
			</timeSeriesSet>
		</subplot>
	</plot>
	<displayGroup name="LangsProfiel">
		<display name="Langsprofiel_Caspargouwse_Wetering">
			<locationSetId>Langsprofiel_Caspargouwse_Wetering</locationSetId>
			<plotId>Langsprofiel_Caspargouwse_Wetering</plotId>
		</display>
	</displayGroup>
</displayGroups> |

...
/displayGroups> |
Single Domain Axis Time Series (1D Spectra plots)
Time series with one domain axis are displayed as one xy chart per time step, like longitudinal profiles. A slider is used to navigate through time.
...
| Code Block | ||||
|---|---|---|---|---|
| ||||
<plot id="WATERBALANS_DAG_CAW"> <subplot stackPlot="true"> <lineStyle>bar</lineStyle> <timeSeriesSet> <moduleInstanceId>BalansAfvoergebieden</moduleInstanceId> <valueType>scalar</valueType> <parameterId>H.G.i.d</parameterId> <locationSetId>AFVOERGEBIEDEN</locationSetId> <timeSeriesType>external historical</timeSeriesType> <timeStep unit="day" timeZone="GMT+1"/> <relativeViewPeriod unit="day" start="-32" end="0"/> <readWriteMode>read only</readWriteMode> </timeSeriesSet> <additionalTimeSeries name="*AFGB_NAAR*" separateSubPlot="true"> <locationFunctionEquals selected="@LOC_ID@" additional="@AFGB_NAAR@"/> <timeSeriesSet> <moduleInstanceId>ImportOpvlWater</moduleInstanceId> <valueType>scalar</valueType> <parameterId>Q.G.15</parameterId> <locationSetId>OPVLWATER_SUBLOC_DEBIETEN</locationSetId> <timeSeriesType>external historical</timeSeriesType> <timeStep unit="minute" multiplier="15"/> <relativeViewPeriod unit="hour" start="-70" end="0"/> <readWriteMode>read only</readWriteMode> </timeSeriesSet> </additionalTimeSeries> <additionalTimeSeries name="*AFGB_VAN*" separateSubPlot="true"> <locationFunctionEquals selected="@LOC_ID@" additional="@AFGB_VAN@"/> <timeSeriesSet> <moduleInstanceId>ImportOpvlWater</moduleInstanceId> <valueType>scalar</valueType> <parameterId>Q.G.15</parameterId> <locationSetId>OPVLWATER_SUBLOC_DEBIETEN</locationSetId> <timeSeriesType>external historical</timeSeriesType> <timeStep unit="minute" multiplier="15"/> <relativeViewPeriod unit="hour" start="-70" end="0"/> <readWriteMode>read only</readWriteMode> </timeSeriesSet> </additionalTimeSeries> </subplot> </plot> |

| Info |
|---|
Display groups may be defined while DELFT-FEWS is running and reloaded by re-opening the time series dialogue. If a mistake is made, then the shortcuts item to open the tree view will not appear and an appropriate message will be generated. After resolving the mistake the item will again become available on re-loading the display. |