...
- 2D data, e.g. water level
- 3D data, e.g. a combination of uTimeSeriesSet, VTimeSeriesSet and sigmaScaleReferenceTimeSeriesSet
- 3D data, e.g. a combination of timeSeriesSet (e.g. temperature) and sigmaScaleReferenceTimeSeriesSet
dataLayer
Use this option to display multiple data grids. Each grid will be displayed in a separate data layer. The layer specified last, will be shown on top.
If a layer contains scalar data (possibly with a locationSet for multiple locations), this will be converted to a grid to display in that layer showing data at the specified (point) locations as follows:
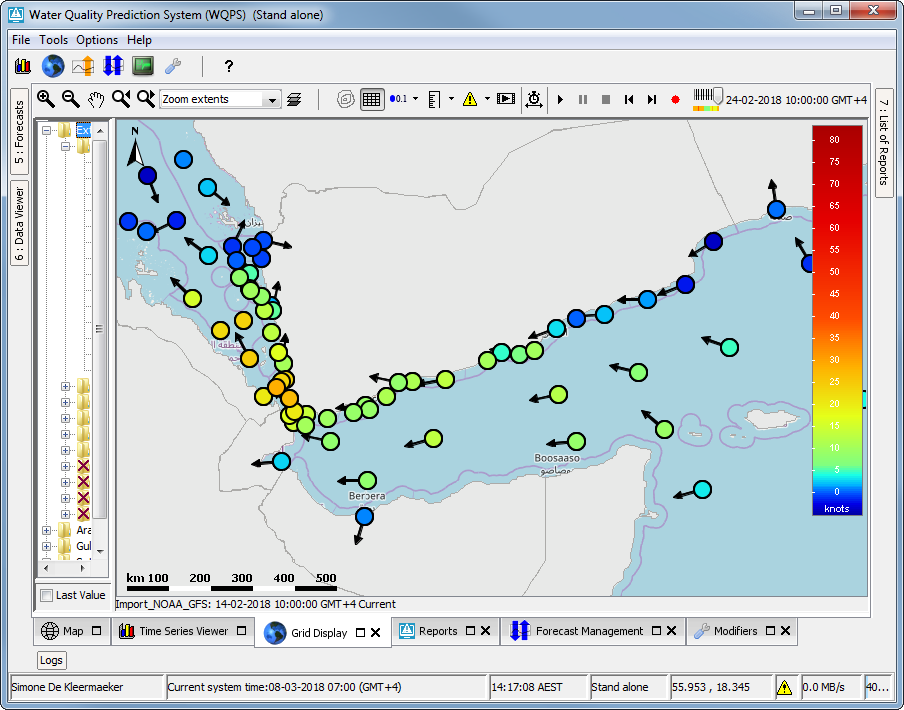
- timeSeriesSet: displayed as dots (see figure)
- uTimeSeriesSet and vTimeSeriesSet: displayed as arrows
- uTimeSeriesSet and vTimeSeriesSet, as well as a timeSeriesSet for the wind velocity for the same location(s): displayed as dots and arrows combined, resembling wind vanes (see figure)

legendStyle
The legend can be shown as table legend or as bar legend.
Default legend style is table. Bar legend shows fluent scale bar on the right.
...