...
![]()
We still have the green and blue boxes with the white check marks. They represent a server (green) or local (blue) run, with the same T0 and state settings as shown in the IFD.
Prior to 2014.02 you would not see an icon at all if the T0 in the IFD was different than the T0 of the approved run in the database, or if the state settings in the IFD were different than the state settings of the approved run in the database. For releases starting with 2014.02, you will see multiple icons for the various situation:
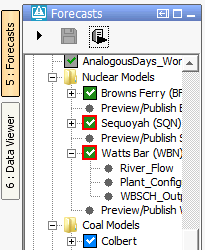
A grey box with either a green or blue check mark. A grey box means the T0 of the approved run in the database is different than the one in the IFD. The check mark indicates whether the approved run is a local or a server run.
A yellow box with either a green or blue check mark. A yellow box means the state settings of the approved run in the database are different than the settings in the IFD. For example you might have a different warm state, warm state search interval, or forecast length. The check mark indicates whether the approved run is a local or a server run."

As of 2016.01, The IFD status icon can be surrounded by a red outline. See figure below. This red outline surrounding the IFD status icon indicates that the workflow task completed but not all of the data has been synchronised back to the operator client. This red outline feature is disabled for DDA clients as it pertains only to synchronisation in LDS clients.
Go to next segmentAdjust T0
...