...
- timeSeriesSet: displayed as dots (see figure)
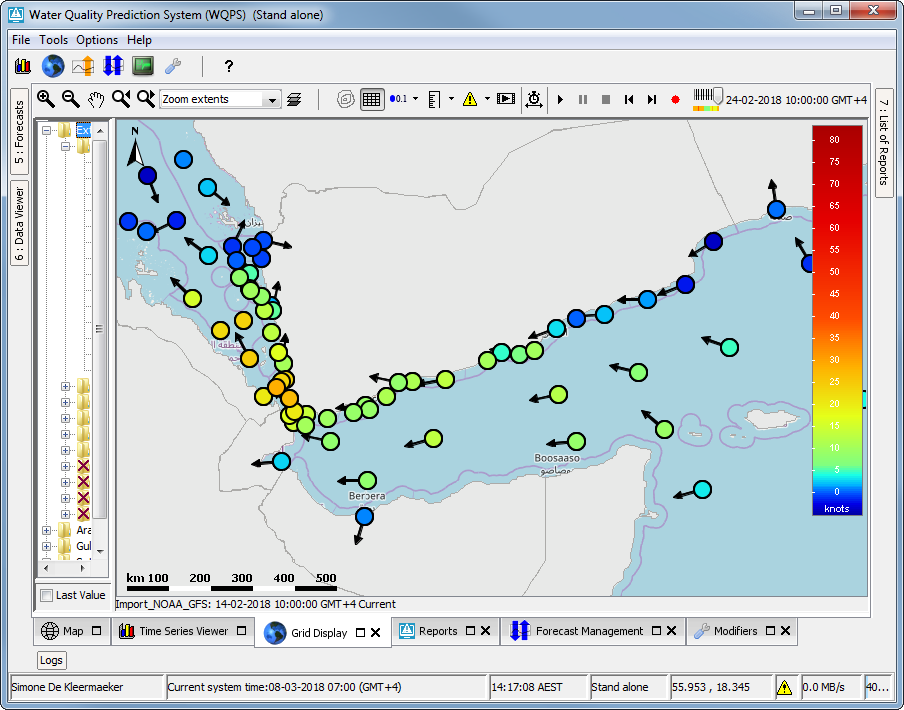
- uTimeSeriesSet and vTimeSeriesSet: displayed as arrows
- uTimeSeriesSet and vTimeSeriesSet, as well as a timeSeriesSet for the wind velocity for the same location(s): displayed as dots and arrows combined, resembling wind vanes (see figure)

showThumbnailsPanel
If this is true, then the grid display shows the spatial thumbnails panel when this grid plot is selected. Otherwise the grid display will not show the spatial thumbnails panel when this grid plot is selected. Default is false. After this grid plot has been selected, the user can still switch on/off the spatial thumbnails panel manually, using the toggle button in the grid display.
Since 2017.02, if this element is never configured for any grid plot, the user settings will be used to decide whether the thumbnails panels is shown on startup, and the panel will remain shown / hidden when a different grid plot is selected. If this element is configured for any grid plot, the thumbnails panel will always be hidden on startup, and actively shown / hidden when selecting a different grid plot depending on the configuration.
Before 2017.02, the user settings were never used to reinstate the status of the thumbnails panel on startup, the panel was always hidden. When selecting grid plots, the panel was shown / hidden depending on the configuration, until the user manually switches the panel on or off. Once a manual change was made, the panel remained shown / hidden even when selecting different grid plots for the remainder of the session.
legendStyle
The legend can be shown as table legend or as bar legend.
Default legend style is table. Bar legend shows fluent scale bar on the right.
...