...
The forecaster help panel shows user provided documentation which is available for a node. Currently the following formats are supported: textfilestext-files, images and pdf-files. Users can place documents in a directory within predefined directories.
These directories can be configured in the topology.xml configuration file by adding a forecasterHelperDirectories element that contains a directory element for all directories.
...
If this is not present in the topology.xml the directory in the global.properties defined by the INFORMATION_PANEL_FOLDER property will be used.
Within Within these directories each node has its own directory. The directory should have the same name as the node id.
Within that directory the documentation for that node can be placed. If you make use sub-folders, make sure to also include the main folder as a directory when you list the <forecasterHelperDirectories>. Documents in the folder configured as <allNodesDirectory> will be visible at all nodes.
| Code Block |
|---|
<forecasterHelperDirectories> <directory>$DOCUMENTS_ROOT_FOLDER$</directory> <directory>$DOCUMENTS_ROOT_FOLDER$/subfolder_1/</directory> <directory>$DOCUMENTS_ROOT_FOLDER$/subfolder_2</directory> <allNodesDirectory>$DOCUMENTS_ALWAYSVISIBLE_FOLDER$</allNodesDirectory>--> </forecasterHelperDirectories> |
Below an example of the tool window forecaster help. In this example the forecaster has two documents available for information.
If If multiple directories are configured this window will show all available files for the node from the different predefined directories together.
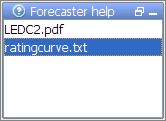
When one of the files is selected in this panel the content of the selected file is shown in the document viewer.
The The document viewer is a dockable window in the centre of the Delft-FEWS Operator Client (or SA) GUI.
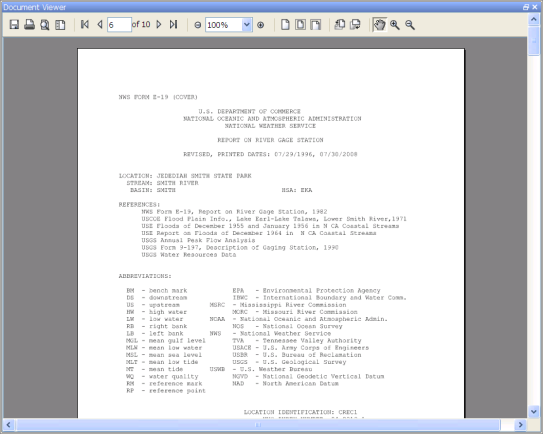
When a text file is selected, it can also be edited. To facilitate this an edit and save button are displayed above the document when selecting a text file.
...
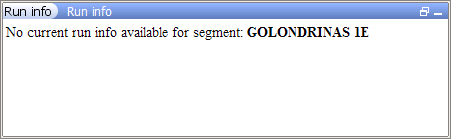
The run info panel shows detail information of the latest run of the workflow of the selected node.
If If the workflow of the node has not run yet for the current T0 then the panel will show that there is no current run info available
When the workflow has run. The status can either be succesfullsuccessful, failed or partly successful.
Only Only when the workflow was succesfull successful than the icon of that node will be set to green. The run status will be shown green in the run info box.

...
To add a new message, click the ‘Add message’ button. In the pop-up window, the Event time can be entered, the Log Level selected, as well as a User, Event Code and a Log Template. By default the Current system time is entered as well as the user name. The Log template can be used to assist the forecaster with a new message. The message will be synchronized to the server side and from there to the other users.

A message can be made specific to a node in the Forecasts display, by selecting this node before you add a message. If no node is selected, the message is always visible. All messages are also visible in the System Monitor display, in the Forecaster Notes tab. This tab allows querying of the messages.
...
Below is a list of all possible steps in creating a forecast with the IFD. Please note that not all of the listed steps are obligated.
- Start Delft-FEWS
- Selecting the forecast panel
- Reviewing the topology
- Review the list of available state date/times
- Adjust state and/or forecast length
- Starting the forecast process and selecting the workflow for which the forecast should be made
- Reviewing workflow status
- Reviewing graphs (graph display listens to topology selection)
- Reviewing graphs (graph display is independent from topology selection)
- Continue with the forecast process downstream
- Ending the forecast process
Starting Delft-FEWS
After starting FEWS, the map-Map display will be displayed in the centre and the Forecast Panel-tab at the left will be selected.
This the default layout. The layout after starting Delft-FEWS is however configurable by creating and saving a custom layout by using the option Save layout in the File menu.
...
It is not possible to create modifiers in a synchronization client until the local datastore is fully synched with the central data storedatabase.
To indicate that the IFD is doing its initial synchronization after startup the forecast-button shows a hour glass icon.

While the Operator Client if synchronizing, it is already possible to view scalar and spatial data. When the initial synchronization is finished the icon will change to a pencil icon to indicate that it is possible to create modifiers.
...
By pressing the Edit Run Options button at the bottom of the forecast dialog the user will have access to alternative ways of selecting states. After pressing the advanced button a dialog will be shown in which the user can select the state, forecast length and a what-if scenario.
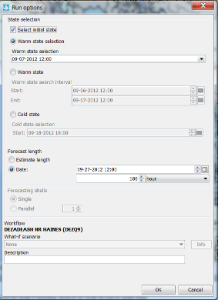
After selecting the OK-button the selected task properties will be applied and used in the runs.
...
The icons in the forecast tree indicate the status of the workflow of a node. A refresh-icon indicate that a workflow is running. An hourglass indicates that a workflow is scheduled to run. More details about the icons can be found in 24 Topology
...
When a run has finished the results of the run should be reviewed. By selecting the plot overview at the right a list of thumbnails will be displayed. For each graph available for the current node a thumbnail will be shown. To display a graph, the forecaster selects a thumbnail and then this graph is displayed in the main plot window. The plot display will show the selected graph. The Plot Overview panel can be undocked. When the display is expanded the plots are automatically resized.
...
All windows in the centre section of Delft-FEWS can be undocked. This can easily be done by clicking on the square-box icon beside the x-icon at the tab of each display.
Undocking the windows allows the forecaster to arrange the windows as they like.
After clicking on the icon the display will automatically be undocked. Putting the display back in docking mode can be done by clicking on the double square icon at the top of the display. By clicking on the x-icon the display can be closed.
Save display layout and reload on opening with same user
By default Delft-FEWS will start with the map display opened in the centre section of the display and with the map display, data display and the topology display docked in the center section of Delft-FEWS. It is possible to customize the display layout. First step in customizing the display layout is to manually place the display in the desired display layout. In the example below three displays are undocked and the graph-tab and the display are moved to the left section of the display. In the File-menu the user can store this layout by selecting the option store layout. The next time Delft-FEWS is started it will start with the stored layout.
...