...
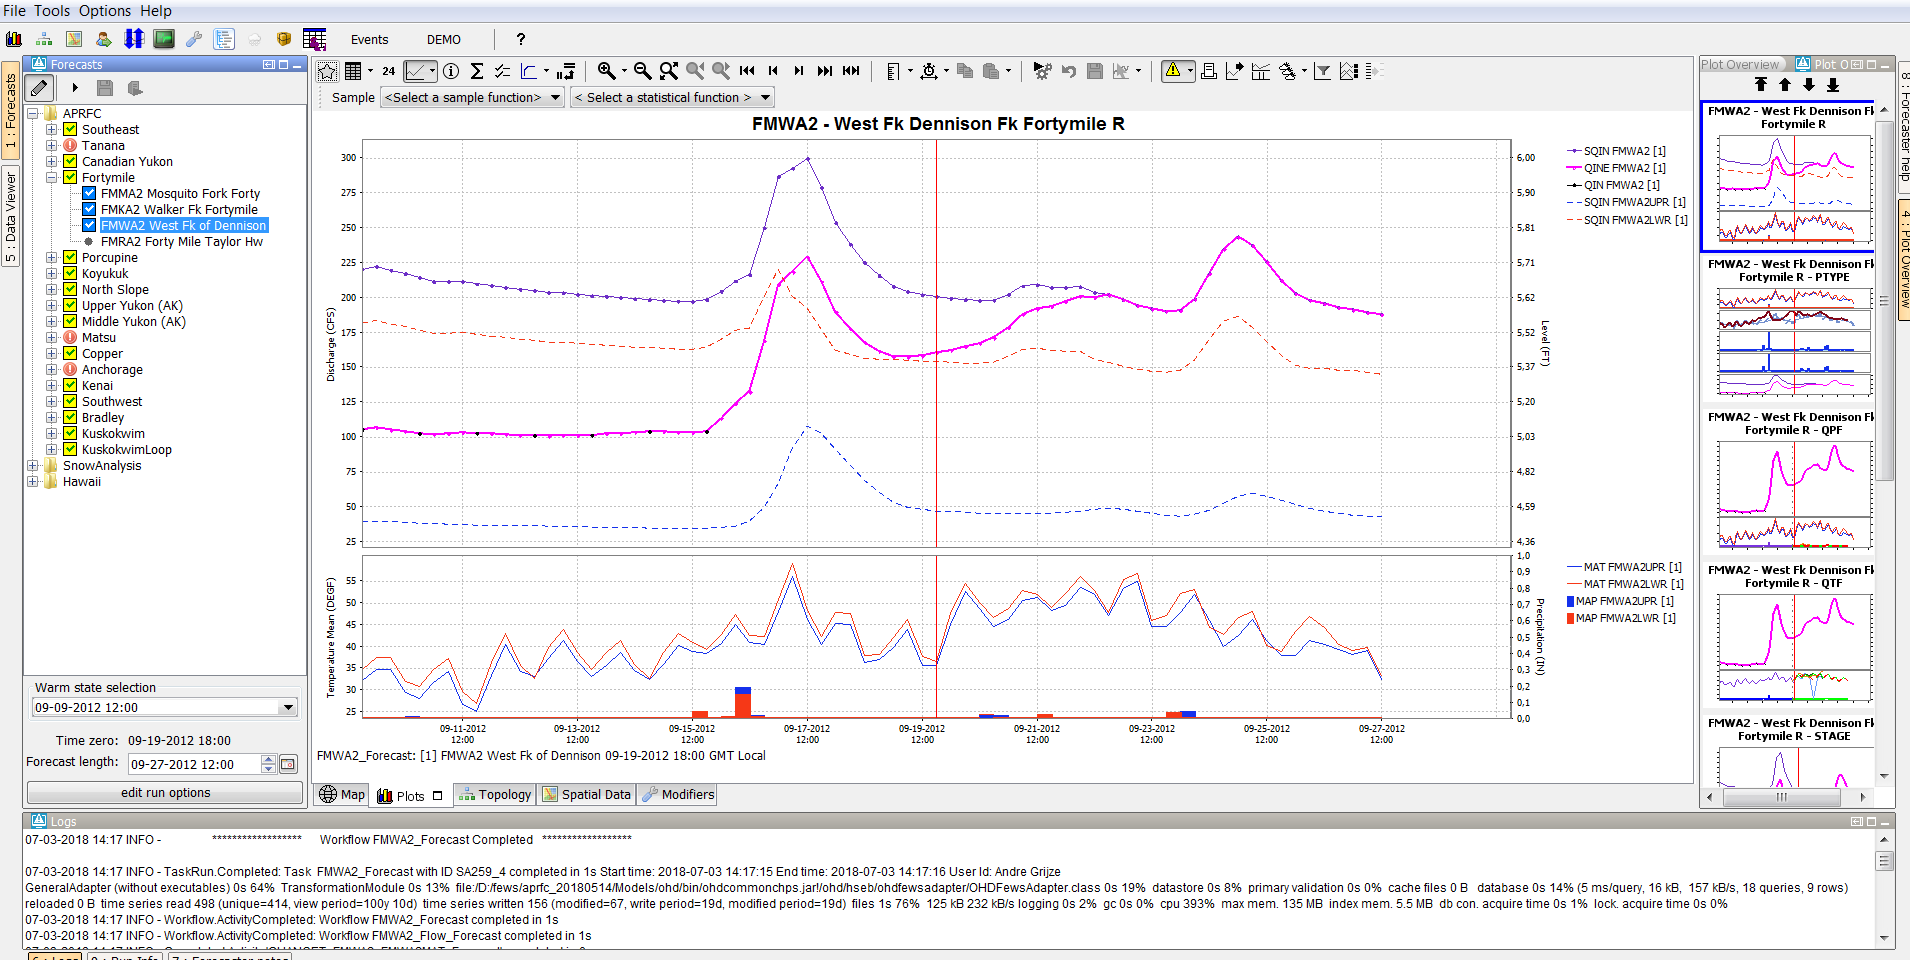
The plot display is used to show scalar time series. Each A topology node is can be connected to a display group. After selecting When a topology node is selected and there is a display group connected to this node then the first plot of that display group will be shown automatically. If there is already a node selected then Delft-FEWS will first try to find a plot with the same location and parameter as currently displayed if that is not possible then the first plot will be displayed.
...
When a plot is locked, the display is locked to that set of time series. When the forecaster selects another node, the plot will continue to display the original time series and will not change. However when new data is brought in, the plot is updated with new data. When the toggle-button is switched off (icon changes to unlock) the plot window is updated automatically when a new node is selected.
...