Display true color imagery
workflowSpatialDisplay
| scrollbar |
|---|
...
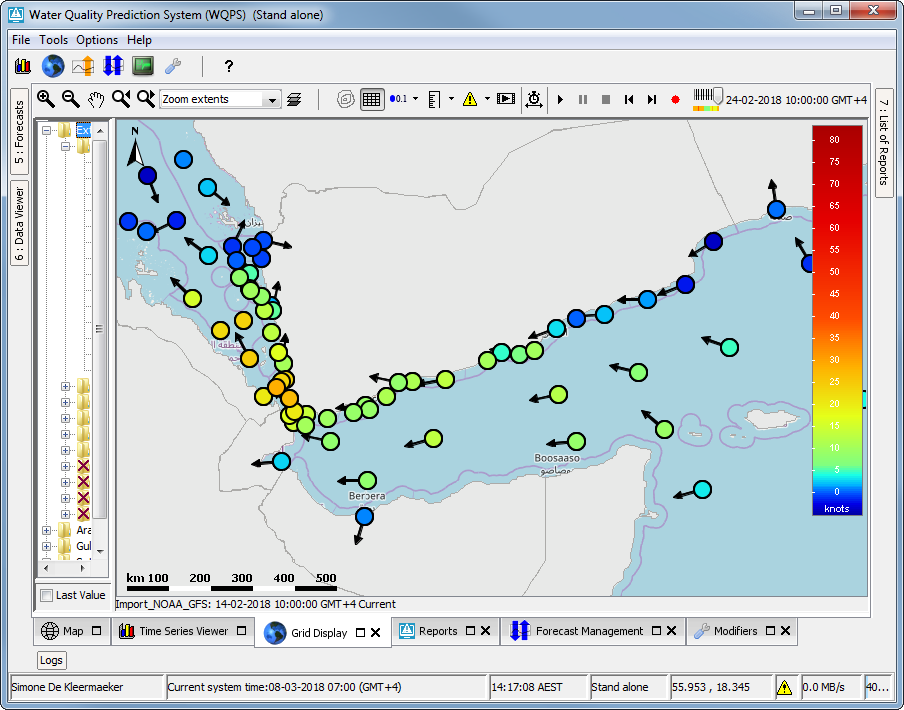
- timeSeriesSet: displayed as dots (see figure)
- uTimeSeriesSet and vTimeSeriesSet: displayed as arrows
- uTimeSeriesSet and vTimeSeriesSet, as well as a timeSeriesSet for the wind velocity for the same location(s): displayed as dots and arrows combined, resembling wind vanes (see figure)
...

showArrowsOnLines
This element is available since 2018.01, in combination with a dataLayer containing a timeSeriesSet element. If this is set to true (false by default) and the locationSet in the timeSeriesSet contains (poly)-lines, the lines drawn in the spatial display will include directional arrows. If the time series has a positive value for a line, the arrow will point from the start of the line (first point found in the shape file) to the end of the line (second point found in the shape file). If the value is negative, the arrow is inverted. See the figures for examples.
...
| Code Block | ||||
|---|---|---|---|---|
| ||||
<dataLayer> <visibleInTimeSeriesDisplay>true</visibleInTimeSeriesDisplay> <visibleInSpatialDisplay>true</visibleInSpatialDisplay> <arrowDirection>from</arrowDirection> <multipleArrowsPerValue>false</multipleArrowsPerValue> <arrowMinimumPixelDistanceBetweenTwoCellCenters>2</arrowMinimumPixelDistanceBetweenTwoCellCenters> <valueTimeSeriesSet> <moduleInstanceId>Import_Wavenet</moduleInstanceId> <valueType>scalar</valueType> <parameterId>Wave.obs.total.height</parameterId> <locationSetId>UK_Coastal_Gauged_Wave</locationSetId> <timeSeriesType>external historical</timeSeriesType> <timeStep unit="nonequidistant"/> <relativeViewPeriod unit="hour" start="-48" startOverrulable="true" end="0" endOverrulable="false"/> <readWriteMode>read only</readWriteMode> </valueTimeSeriesSet> <directionTimeSeriesSet> <moduleInstanceId>Import_Wavenet</moduleInstanceId> <valueType>scalar</valueType> <parameterId>Wave.obs.peak.dir</parameterId> <locationSetId>UK_Coastal_Gauged_Wave</locationSetId> <timeSeriesType>external historical</timeSeriesType> <timeStep unit="nonequidistant"/> <relativeViewPeriod unit="hour" start="-48" startOverrulable="true" end="0" endOverrulable="false"/> <readWriteMode>read only</readWriteMode> </directionTimeSeriesSet> </dataLayer> <classBreaks> <lowerColor>blue</lowerColor> <upperColor>red</upperColor> <lowerSymbolSize>20</lowerSymbolSize> <upperSymbolSize>100</upperSymbolSize> <lowerValue>0</lowerValue> <lowerValue>5</lowerValue> </classBreaks> |
uTimeSeriesSet / vTimeSeriesSet
...
- <movingAverageTimeSpan>: When configured a slider is displayed with the configured time spans. If a time span is selected in the slider, then the data in the grid display is aggregated (moving average) using that time span. The start of a timeSpan is exclusive and the end of a timeSpan is inclusive. Configure a very large time span (eg 100000 days) to allow the user to see the total average of the loaded time series.
- <movingAccumulationTimeSpan>: When configured an accumulation slider is displayed with the configured time spans. If a time span is selected in the slider, then the data in the grid display is aggregated (moving accumulation) using that time span. The start of a timeSpan is exclusive and the end of a timeSpan is inclusive. Configure a very large time span (eg 100000 days) to allow the user to see the total sum of the loaded time series.
- <accumulationTimeSpan>: Since 2014.02. When configured an accumulation slider is displayed with the configured time spans. When a time span is selected with the slider, the interval of the ticks in the time slider in the grid display is recalculated to the selected time step. Configure a very large time span (eg 100000 days) to allow the user to see the total sum of the loaded time series.
- <accumulationTimeStep>: Since 2016.02. When configured an accumulation slider is displayed with the configured time steps. When a time step is selected with the slider, the interval of the ticks in the time slider in the grid display is recalculated to the selected time step. Configure a very large time step (eg 100 years) to allow the user to see the total sum of the loaded time series.
- <hideLastValueCheckBox>: Since 2017.02. Default false. When set to true, the "show last value" will be hidden. Note that if an accumulation slider is configured, the checkbox will be hidden by default.
Note: When using this functionality in the Grid Display it is important to know that when hte moving option is deactivated, the accumulation periods are relative to the Display time of the Grid Display. When you want to step with daily time steps at 00:00 hours through a rainfall series, first set the display time to 00:00 hours. Then accumulate the data to daily steps. The accumulated timeseries will calculate daily interval series form 00:00 to 00:00 next day.
Config example for configuring a moving accumulation time span slider:
...
Definition of the maps used as a background to the dynamic grid displayed. The layout and zoom extent are also defined in this element. More information on the configuration of the geoMap element can be found here.
| Anchor | ||||
|---|---|---|---|---|
|
| Anchor | ||||
|---|---|---|---|---|
|
...
| Code Block | ||||
|---|---|---|---|---|
| ||||
<gridPlot id="3D_data" name="3D data display">
    <dataLayer>
        <arrowColor>white</arrowColor>
        <arrowSymbol>flow</arrowSymbol>
        <multipleArrowsPerValue>false</multipleArrowsPerValue>
        <uTimeSeriesSet>
            <moduleInstanceId>DFlowFM_FC</moduleInstanceId>
            <valueType>grid</valueType>
            <parameterId>C.simulated.u</parameterId>
            <locationSetId>DFlowFM_0_####</locationSetId>
            <timeSeriesType>simulated forecasting</timeSeriesType>
            <timeStep unit="nonequidistant"/>
            <readWriteMode>read complete forecast</readWriteMode>
        </uTimeSeriesSet>
        <vTimeSeriesSet>
            <moduleInstanceId>DFlowFM_FC</moduleInstanceId>
            <valueType>grid</valueType>
            <parameterId>C.simulated.v</parameterId>
            <locationSetId>DFlowFM_0_####</locationSetId>
            <timeSeriesType>simulated forecasting</timeSeriesType>
            <timeStep unit="nonequidistant"/>
            <readWriteMode>read complete forecast</readWriteMode>
        </vTimeSeriesSet>
        <uvAmplitudeParameterId>C.simulated.speed</uvAmplitudeParameterId>
        <uvDirectionParameterId>C.simulated.dir</uvDirectionParameterId>
        <sigmaScaleReferenceTimeSeriesSet>
            <moduleInstanceId>DFlowFM_FC</moduleInstanceId>
            <valueType>grid</valueType>
            <parameterId>WD.simulated</parameterId>
            <locationSetId>DFlowFM.merged</locationSetId>
            <timeSeriesType>simulated forecasting</timeSeriesType>
            <timeStep unit="nonequidistant"/>
            <readWriteMode>read complete forecast</readWriteMode>
        </sigmaScaleReferenceTimeSeriesSet>
    </dataLayer>

    <barLegend>
        <position>right</position>
        <width>50</width>
        <length>400</length>
        <labelsInside>true</labelsInside>
    </barLegend>
    <classBreaksId>Class.Currents</classBreaksId>
    <contourLinesColor>antique white</contourLinesColor>
</gridPlot>
|
...
ClassBreak labels
If label is configured in a classbreak, the legend will show the label in the table instead of the values. When a mouse is hovering over a point, the tooltip will show the configured value if there is no label, and the label plus the value if there is a label (since 2018.02.). Notice in the example below that one of the breaks has no label.
...