...
Below are two examples of a config and the resulting plot.
| Code Block |
|---|
| language | xml |
|---|
| title | dual axis example (click to expand) |
|---|
| linenumbers | true |
|---|
| collapse | true |
|---|
| <subplot>
<plotWeight>1</plotWeight>
<line>
<color>blue</color>
<axis>left</axis>
<timeSeriesSet>
<moduleInstanceId>ImportTelemetry</moduleInstanceId>
<valueType>scalar</valueType>
<parameterId>H.obs</parameterId>
<locationId>Hydro1</locationId>
<timeSeriesType>external historical</timeSeriesType>
<timeStep unit="minute" multiplier="15"/>
<relativeViewPeriod unit="hour" start="-36" end="36"/>
<readWriteMode>editing visible to all future task runs</readWriteMode>
</timeSeriesSet>
</line>
<line>
<color>blue</color>
<axis>left</axis>
<timeSeriesSet>
<moduleInstanceId>ImportTelemetry</moduleInstanceId>
<valueType>scalar</valueType>
<parameterId>H.rated</parameterId>
<locationId>Hydro3</locationId>
<timeSeriesType>external historical</timeSeriesType>
<timeStep unit="minute" multiplier="15"/>
<relativeViewPeriod unit="hour" start="-36" end="36"/>
<readWriteMode>editing visible to all future task runs</readWriteMode>
</timeSeriesSet>
</line>
<line>
<color>red</color>
<axis>right</axis>
<timeSeriesSet>
<moduleInstanceId>ImportTelemetry</moduleInstanceId>
<valueType>scalar</valueType>
<parameterId>Q.obs</parameterId>
<locationId>Hydro2</locationId>
<timeSeriesType>external historical</timeSeriesType>
<timeStep unit="minute" multiplier="15"/>
<relativeViewPeriod unit="hour" start="-36" end="36"/>
<readWriteMode>editing visible to all future task runs</readWriteMode>
</timeSeriesSet>
</line>
<line>
<color>red</color>
<axis>right</axis>
<timeSeriesSet>
<moduleInstanceId>ImportTelemetry</moduleInstanceId>
<valueType>scalar</valueType>
<parameterId>Q.rated</parameterId>
<locationId>Hydro4</locationId>
<timeSeriesType>external historical</timeSeriesType>
<timeStep unit="minute" multiplier="15"/>
<relativeViewPeriod unit="hour" start="-36" end="36"/>
<readWriteMode>editing visible to all future task runs</readWriteMode>
</timeSeriesSet>
</line>
</subplot>
|
|  Image Modified Image Modified
|
| Code Block |
|---|
| language | xml |
|---|
| title | dual axis with 2 parameterGroups example (click to expand) |
|---|
| linenumbers | true |
|---|
| collapse | true |
|---|
| <subplot>
<plotWeight>1</plotWeight>
<line>
<color>blue</color>
<axis>right</axis>
<timeSeriesSet>
<moduleInstanceId>ImportTelemetry</moduleInstanceId>
<valueType>scalar</valueType>
<parameterId>H.obs</parameterId>
<locationId>Hydro1</locationId>
<timeSeriesType>external historical</timeSeriesType>
<timeStep unit="minute" multiplier="15"/>
<relativeViewPeriod unit="hour" start="-36" end="36"/>
<readWriteMode>editing visible to all future task runs</readWriteMode>
</timeSeriesSet>
</line>
<line>
<color>red</color>
<timeSeriesSet>
<moduleInstanceId>ImportTelemetry</moduleInstanceId>
<valueType>scalar</valueType>
<parameterId>Q.obs</parameterId>
<locationId>Hydro2</locationId>
<timeSeriesType>external historical</timeSeriesType>
<timeStep unit="minute" multiplier="15"/>
<relativeViewPeriod unit="hour" start="-36" end="36"/>
<readWriteMode>editing visible to all future task runs</readWriteMode>
</timeSeriesSet>
</line>
</subplot>
|
| 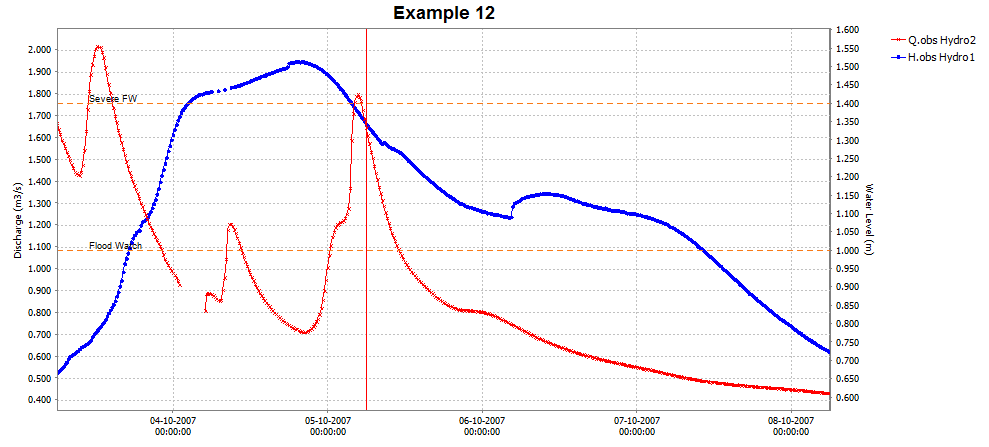 Image Modified Image Modified
Threshold line only for timeseries on the right y axis
|
Stage/discharge plots (dual y-axis plot)
...
Below an configuration and resulting plot
| Code Block |
|---|
| language | xml |
|---|
| title | ratingAxis example (click to expand) |
|---|
| linenumbers | true |
|---|
| collapse | true |
|---|
| <subplot>
<line>
<color>black</color>
<lineStyle>none</lineStyle>
<markerStyle>+</markerStyle>
<markerSize>3</markerSize>
<timeSeriesSet>
<moduleInstanceId>ImportTelemetry</moduleInstanceId>
<valueType>scalar</valueType>
<parameterId>Q.rated</parameterId>
<locationId>Hydro4</locationId>
<timeSeriesType>external historical</timeSeriesType>
<timeStep unit="minute" multiplier="15"/>
<relativeViewPeriod unit="hour" start="-36" end="36"/>
<readWriteMode>editing visible to all future task runs</readWriteMode>
</timeSeriesSet>
</line>
<line>
<color>black</color>
<lineStyle>solid</lineStyle>
<markerStyle>circle</markerStyle>
<markerSize>6</markerSize>
<axis>left</axis>
<ratingAxis>
<parameterGroupId>Water Level</parameterGroupId>
<transformationType>dischargeStage</transformationType>
</ratingAxis>
<timeSeriesSet>
<moduleInstanceId>ImportTelemetry</moduleInstanceId>
<valueType>scalar</valueType>
<parameterId>Q.obs</parameterId>
<locationId>Hydro2</locationId>
<timeSeriesType>external historical</timeSeriesType>
<timeStep unit="minute" multiplier="15"/>
<relativeViewPeriod unit="hour" start="-36" end="36"/>
<readWriteMode>editing visible to all future task runs</readWriteMode>
</timeSeriesSet>
</line>
</subplot>
|
|  Image Modified Image Modified
|
timeSeriesSet
chainageLocationSetId
...
| Code Block |
|---|
| language | xml |
|---|
| title | domainParameterId example (click to expand) |
|---|
| linenumbers | true |
|---|
| collapse | true |
|---|
|
<subplot>
	<classBreaks>
		<break symbolSize="10" color="000080" lowerValue="0"/>
		<break symbolSize="10" color="0000A8" lowerValue="0.0005"/>
		<break symbolSize="10" color="0000E6" lowerValue="0.001"/>
		<break symbolSize="10" color="004DFF" lowerValue="0.0025"/>
		<break symbolSize="10" color="00B3FF" lowerValue="0.005"/>
		<break symbolSize="10" color="1AFFE5" lowerValue="0.01"/>
		<break symbolSize="10" color="80FF80" lowerValue="0.015"/>
		<break symbolSize="10" color="E6FF19" lowerValue="0.02"/>
		<break symbolSize="10" color="FFB200" lowerValue="0.025"/>
		<break symbolSize="10" color="FF4C00" lowerValue="0.035"/>
		<break symbolSize="10" color="E50000" lowerValue="0.04"/>
		<break symbolSize="10" color="A80000" lowerValue="0.045"/>
		<break symbolSize="10" color="800000" lowerValue="0.05"/>
	</classBreaks>
	<direction>from</direction>
	<timeSeriesSet>
		<moduleInstanceId>Swan_dcsmv6_hirlam_forecast_import</moduleInstanceId>
		<valueType>scalar</valueType>
		<parameterId>Wave.variancedensity2D.voorspeld</parameterId>
		<domainParameterId>f</domainParameterId>
		<domainParameterId>dir</domainParameterId>
		<locationSetId>SWAN_POINTS2</locationSetId>
		<timeSeriesType>simulated forecasting</timeSeriesType>
		<timeStep unit="minute" multiplier="60"/>
		<relativeViewPeriod unit="day" start="-2" end="2"/>
		<readWriteMode>read only</readWriteMode>
	</timeSeriesSet>
</subplot>
|
| Anchor |
|---|
| visibleInTable |
|---|
| visibleInTable |
|---|
|
visibleInTable, visibleInPlot| Info |
|---|
Important notice: It is possible to configure <visibleInTable>,<visibleInPlot> outside of the wrapper elements <line>, <clusteredBars> or <area>, but it should not be done.
There is a bug in one of the external libraries, that causes a mixup, and the wrong <visibleInTable>,<visibleInPlot> will be paired with the wrong timeSerieSet. Always use <visibleInTable> <visibleInPlot> together with <line>, <clusteredBars> or <area>. |
...
To tie the date/time ticks to the valid times of the (cardinal) time step, configure ‘tickTimeStep’ in DisplayGroups.xml. For example, if the ‘tickTimeStep’ is 6 hours then the ticks are always aligned with the synoptic times 00Z, 06Z, 12Z, 18Z. When we are zooming out and there is no space to display all date/times along the x-axis, then one or more synoptic times ticks are omitted. For example we see ticks at 00Z and 18Z.
singleLocationDisplays
Adds multiple displays at once to this display group. Every display will show only one location.
showAsVerticalProfile
...
To display the data in a scatterplot, you can chose between two options: <showAsScatterPlot> and <addInteractionScatterPlot> If you chose the first one, the
- <showAsScatterPlot>: TimeSeries display will be replaced with a
...
- scatterplot
- <addInteractionScatterPlot>: you can turn on an extra scatterplot that is displayed next to the original time series.. The interaction scatterplot button has to be enabled in the
...
- TimeSeriesDisplayConfig.xml
...
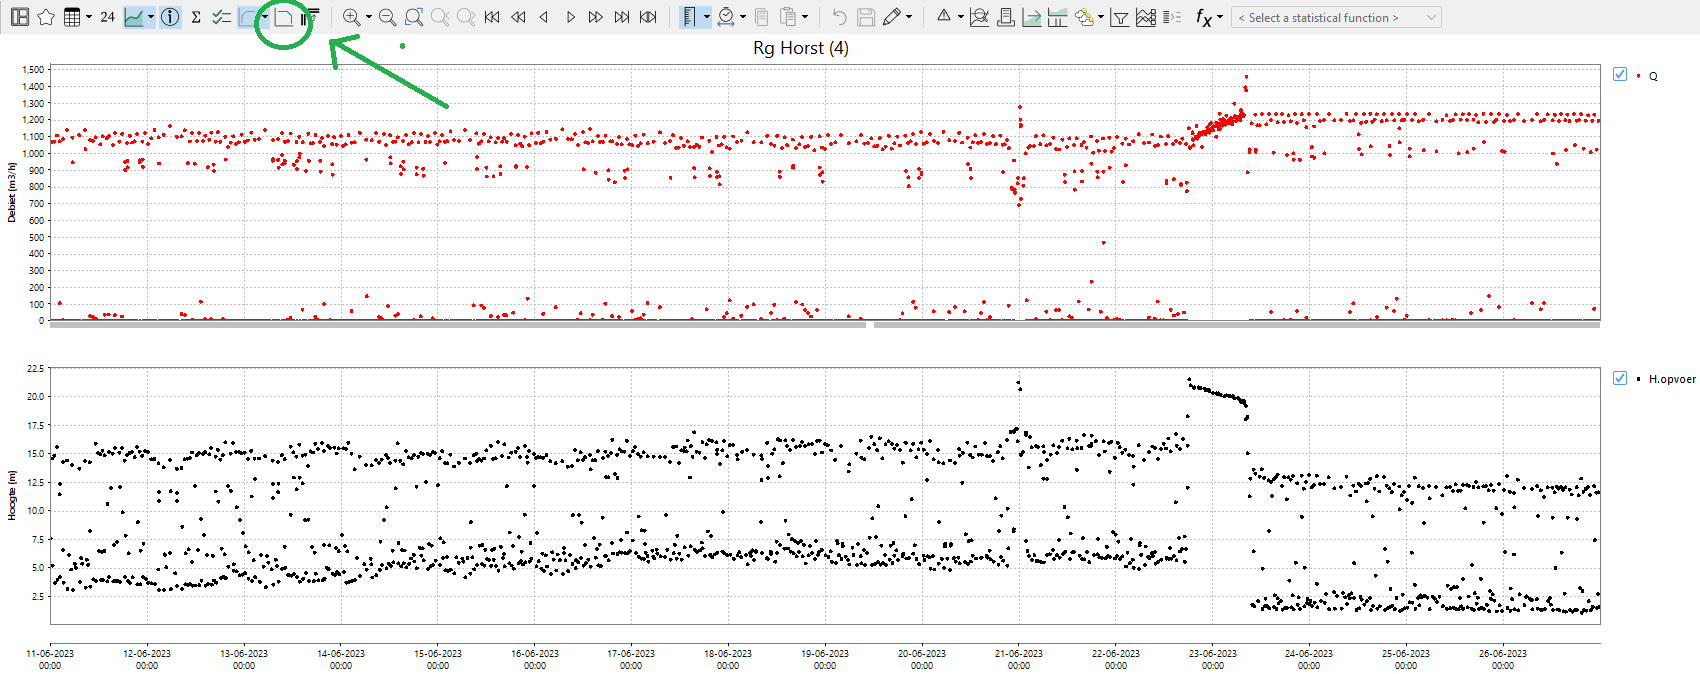 Image Removed
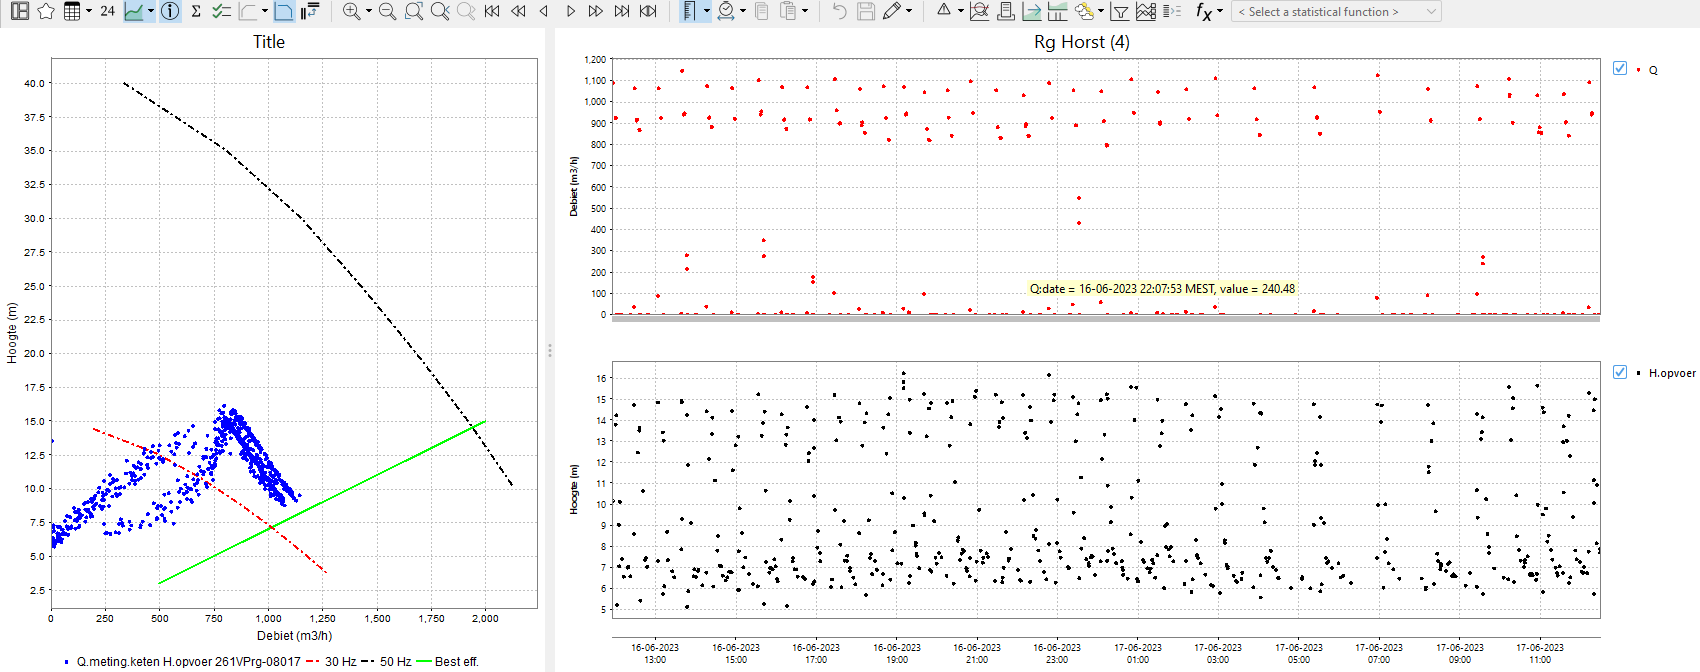 Image Removed
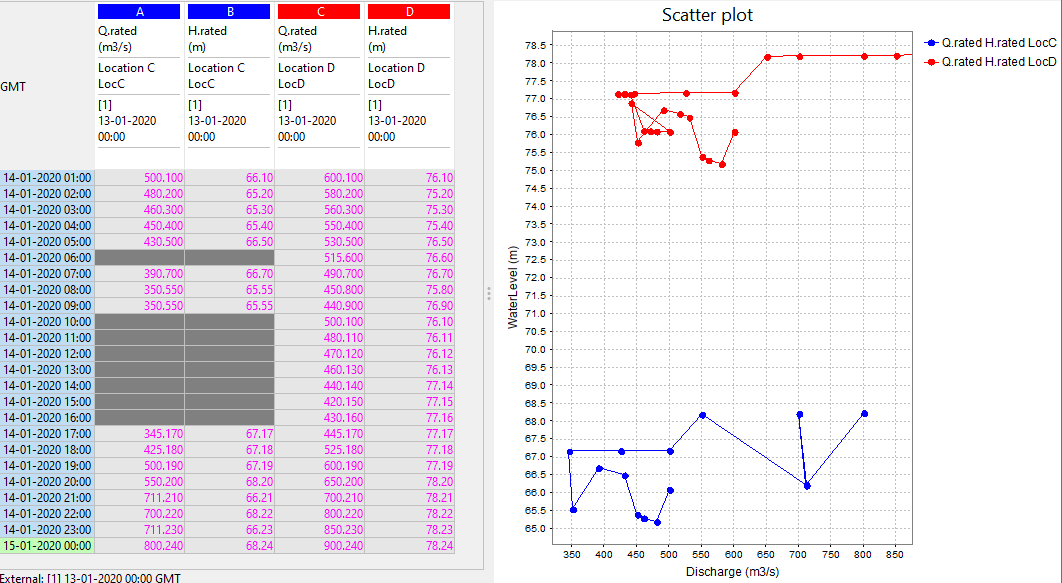
With the elements <xAxisRange> and <yAxisRange> the range of the x and y axis can be defined.
Image Added
Image Added
Pairing of time series
By default all time series with the same location are paired up.
Since 2017.02 time series with the same parameter can be paired up by using the element <createPairsByMatchingParameter>true</createPairsByMatchingParameter>
...
, but this behavior can be changed with the following configuration options.
- when there are 2 time series they will be paired up
...
- , regardless of their location or parameter (since 2019.
...
- 02)
- createPairsByMatchingParameter: time series with the same parameter can be paired (since 2017.02)
- markerVisibility:
...
- choose whether all data points
...
...
...
...
- is visualised (since 2019.02)
- matchTimeSeriesPair: pair up the time series based on their configured order:
...
- timeSeriesOrder (since 2020.02
...
- )
- draw colored areas based on configured points. Also, in the plot, the grid lines in the background and the interaction line are visible, and legends are added next to the plot.
...
Scatter the scatter series are shown in standard time series table and all all configuration elements are optional , so it is enough suffices to configure <showAsScatterPlot/> (since 2022.02).
A simple scatter plot , without any additional options , is shown below :
An example of scatter plot configuration that uses all optional elements, together with the resulting plot:
| Code Block |
|---|
| language | xml |
|---|
| title | Scatter plot example (click to expand) |
|---|
| linenumbers | true |
|---|
| collapse | true |
|---|
| <displayGroup id="pk" name="Pompkrommes">
<singleParentLocationDisplays>
<locationId>261VPrg-08017</locationId>
<locationId>261VPrg-10021</locationId>
<plotId>pompkromme</plotId>
<addInteractionScatterPlot>
<xAxisParameterId>Q.meting.keten</xAxisParameterId>
<yAxisParameterId>H.opvoer</yAxisParameterId>
<dataLine>
<lineColor>pink</lineColor>
<lineStyle>none</lineStyle>
</dataLine>
<chartTitle>Pompkarakteristieken</chartTitle>
<interactionLine>
<lineColor>red</lineColor>
<lineStyle>solid;thick</lineStyle>
<lineWidth>2</lineWidth>
<labelText>30 Hz</labelText>
<referencePoints>
<xAttributeId>Q_30Hz</xAttributeId>
<yAttributeId>H_30Hz</yAttributeId>
</referencePoints>
</interactionLine>
<interactionLine>
<lineColor>blue</lineColor>
<lineStyle>solid</lineStyle>
<lineWidth>1</lineWidth>
<labelText>samenloop</labelText>
<referencePoints>
<point>
<x>600</x>
<y>5</y>
</point>
<point>
<x>700</x>
<y>4</y>
</point>
<point>
<x>1200</x>
<y>8</y>
</point>
</referencePoints>
</interactionLine>
<referencePointsLegendLabel>Q</referencePointsLegendLabel>
<coloredBackgroundArea>
<label>werkgebied0</label>
<color>green</color>
<opaquenessPercentage>25</opaquenessPercentage>
<point>
<x>600</x>
<y>5</y>
</point>
<point>
<x>700</x>
<y>4</y>
</point>
<point>
<x>1200</x>
<y>8</y>
</point>
</coloredBackgroundArea>
<coloredBackgroundArea>
<label>werkgebied1</label>
<color>green1</color>
<opaquenessPercentage>10</opaquenessPercentage>
<xAttributeId>enkelloop_Q</xAttributeId>
<yAttributeId>enkelloop_H</yAttributeId>
</coloredBackgroundArea>
<overrulingSeriesLabel>QH</overrulingSeriesLabel>
<markerVisibility>all</markerVisibility>
</addInteractionScatterPlot>
</singleParentLocationDisplays>
</displayGroup> |
|
|---|
...
|  Image Modified Image Modified
|
|---|
Example from Operational system:
...