...
| Code Block |
|---|
| language | xml |
|---|
| title | additionalTimeSeries example (click to expand) |
|---|
| linenumbers | true |
|---|
| collapse | true |
|---|
| <plot id="WATERBALANS_DAG_CAW">
<subplot stackPlot="true">
<lineStyle>bar</lineStyle>
<timeSeriesSet>
<moduleInstanceId>BalansAfvoergebieden</moduleInstanceId>
<valueType>scalar</valueType>
<parameterId>H.G.i.d</parameterId>
<locationSetId>AFVOERGEBIEDEN</locationSetId>
<timeSeriesType>external historical</timeSeriesType>
<timeStep unit="day" timeZone="GMT+1"/>
<relativeViewPeriod unit="day" start="-32" end="0"/>
<readWriteMode>read only</readWriteMode>
</timeSeriesSet>
<additionalTimeSeries name="*AFGB_NAAR*" separateSubPlot="true">
<locationFunctionEquals selected="@LOC_ID@" additional="@AFGB_NAAR@"/>
<timeSeriesSet>
<moduleInstanceId>ImportOpvlWater</moduleInstanceId>
<valueType>scalar</valueType>
<parameterId>Q.G.15</parameterId>
<locationSetId>OPVLWATER_SUBLOC_DEBIETEN</locationSetId>
<timeSeriesType>external historical</timeSeriesType>
<timeStep unit="minute" multiplier="15"/>
<relativeViewPeriod unit="hour" start="-70" end="0"/>
<readWriteMode>read only</readWriteMode>
</timeSeriesSet>
</additionalTimeSeries>
<additionalTimeSeries name="*AFGB_VAN*" separateSubPlot="true">
<locationFunctionEquals selected="@LOC_ID@" additional="@AFGB_VAN@"/>
<timeSeriesSet>
<moduleInstanceId>ImportOpvlWater</moduleInstanceId>
<valueType>scalar</valueType>
<parameterId>Q.G.15</parameterId>
<locationSetId>OPVLWATER_SUBLOC_DEBIETEN</locationSetId>
<timeSeriesType>external historical</timeSeriesType>
<timeStep unit="minute" multiplier="15"/>
<relativeViewPeriod unit="hour" start="-70" end="0"/>
<readWriteMode>read only</readWriteMode>
</timeSeriesSet>
</additionalTimeSeries>
</subplot>
</plot> |
| |
displayGroup elements
...
locationLoop
By defining a location loop within a displayGroup, the display group will be created for each location of location set configured in the loop.
...
| Code Block |
|---|
| language | xml |
|---|
| title | locationLoop example (click to expand) |
|---|
| linenumbers | true |
|---|
| collapse | true |
|---|
|
	<displayGroup name="Validations Location Loop">
		<displayGroup name=" ">
			<locationLoop>
				<locationSetId>FloodingAreas</locationSetId>
				<includeChildren>true</includeChildren>
				<locationRelationId>L_AREA</locationRelationId>
				<locationRelationId>L_VISIBILIY</locationRelationId>
				<locationRelationId>MEASUREMENT_PARENT</locationRelationId>
			</locationLoop>
			<displayGroup name="Waterbalance">
				<display name="Waterbalance">
					<plotId>Waterbalance</plotId>
				</display>
				<display name="Waterbalance incl. error">
					<plotId>Waterbalance_error</plotId>
				</display>
			</displayGroup>
                           ...
		</displayGroup>
</displayGroup> |
...
display
Definition of a pre-configured display. Each display may contain multiple sub-plots. Multiple displays may be defined per display group.
...
Adds multiple displays at once to this display group. Every display will show only one location.
showAsVerticalProfile
...
...
When true vertical profile timeseries are calculated on the fly from the scalar time series at the child locations of the locations defined in the timeSeriesSet.
| Code Block |
|---|
| language | xml |
|---|
| title | showAsVerticalProfile example (click to expand) |
|---|
| linenumbers | true |
|---|
| collapse | true |
|---|
| <displayGroups version="1.0" xmlns="http://www.wldelft.nl/fews" xmlns:xsi="http://www.w3.org/2001/XMLSchema-instance" xsi:schemaLocation="http://www.wldelft.nl/fews http://fews.wldelft.nl/schemas/version1.0/displayGroups.xsd">
<plot id="waterQuality">
<subplot>
<line>
<color>blue</color>
<lineStyle>solid;thick</lineStyle>
<markerStyle>square</markerStyle>
<timeSeriesSet>
<moduleInstanceId>ProcessObservedWaterquality</moduleInstanceId>
<valueType>scalar</valueType>
<parameterId>WT_obs</parameterId>
<locationId>R_401027</locationId>
<timeSeriesType>external historical</timeSeriesType>
<timeStep unit="hour" multiplier="3"/>
<readWriteMode>read only</readWriteMode>
</timeSeriesSet>
</line>
</subplot>
<subplot>
<line>
<color>turquoise</color>
<lineStyle>solid;thick</lineStyle>
<markerStyle>square</markerStyle>
<timeSeriesSet>
<moduleInstanceId>ProcessObservedWaterquality</moduleInstanceId>
<valueType>scalar</valueType>
<parameterId>EC_obs</parameterId>
<locationId>R_401027</locationId>
<timeSeriesType>external historical</timeSeriesType>
<timeStep unit="hour" multiplier="3"/>
<readWriteMode>read only</readWriteMode>
</timeSeriesSet>
</line>
</subplot>
<subplot>
<line>
<color>cyan</color>
<lineStyle>solid;thick</lineStyle>
<markerStyle>square</markerStyle>
<timeSeriesSet>
<moduleInstanceId>ProcessObservedWaterquality</moduleInstanceId>
<valueType>scalar</valueType>
<parameterId>pH_obs</parameterId>
<locationId>R_401027</locationId>
<timeSeriesType>external historical</timeSeriesType>
<timeStep unit="hour" multiplier="3"/>
<readWriteMode>read only</readWriteMode>
</timeSeriesSet>
</line>
</subplot>
<subplot>
<line>
<color>forest green</color>
<lineStyle>solid;thick</lineStyle>
<markerStyle>square</markerStyle>
<timeSeriesSet>
<moduleInstanceId>ProcessObservedWaterquality</moduleInstanceId>
<valueType>scalar</valueType>
<parameterId>Turbidity_obs</parameterId>
<locationId>R_401027</locationId>
<timeSeriesType>external historical</timeSeriesType>
<timeStep unit="hour" multiplier="3"/>
<readWriteMode>read only</readWriteMode>
</timeSeriesSet>
</line>
</subplot>
<subplot>
<line>
<color>green3</color>
<lineStyle>solid;thick</lineStyle>
<markerStyle>square</markerStyle>
<timeSeriesSet>
<moduleInstanceId>ProcessObservedWaterquality</moduleInstanceId>
<valueType>scalar</valueType>
<parameterId>DO_obs</parameterId>
<locationId>R_401027</locationId>
<timeSeriesType>external historical</timeSeriesType>
<timeStep unit="hour" multiplier="3"/>
<readWriteMode>read only</readWriteMode>
</timeSeriesSet>
</line>
</subplot>
<subplot>
<line>
<color>goldenrod</color>
<lineStyle>solid;thick</lineStyle>
<markerStyle>square</markerStyle>
<timeSeriesSet>
<moduleInstanceId>ProcessObservedWaterquality</moduleInstanceId>
<valueType>scalar</valueType>
<parameterId>DO%_obs</parameterId>
<locationId>R_401027</locationId>
<timeSeriesType>external historical</timeSeriesType>
<timeStep unit="hour" multiplier="3"/>
<readWriteMode>read only</readWriteMode>
</timeSeriesSet>
</line>
</subplot>
</plot>
<displayGroup id="waterquality" name="water quality">
<display id="WQ_R_401027" name="401027 WT, EC, pH, Turbidity, DO">
<relativeViewPeriod unit="hour" start="-336" end="168"/>
<locationId>R_401027</locationId>
<plotId>waterQuality</plotId>
<showAsVerticalProfile>true</showAsVerticalProfile>
</display>
</displayGroup>
</displayGroups>
|
| 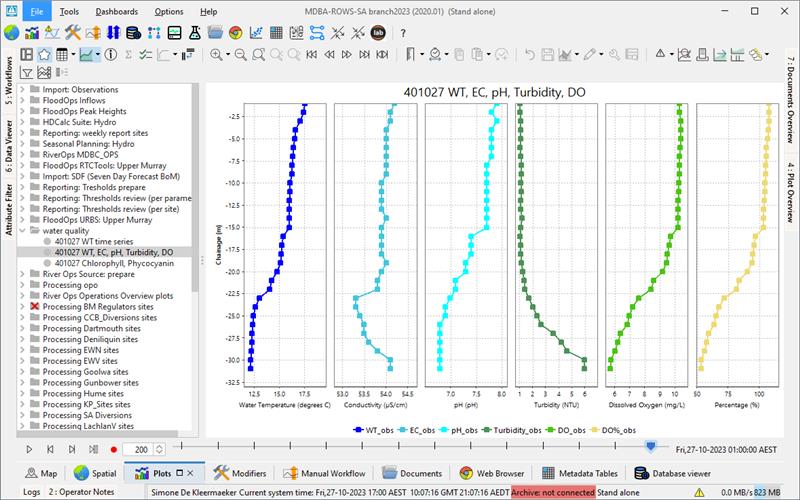 Image Added Image Added
|
showAsScatterPlot
To plot time series, with the values of the different time series on the X and Y axis. - <referencePoints> can be defined in several ways:
- <point> will be shown as an interaction line.
- <xAttributeId>, <yAttributeId> defining the x and y coordinates of the points, the y-coordinates.
Time dependent location attributes are not supported.
- <interactionLine>
- Any number of interaction lines can be added to the plot. Lines configured with points or location attributes can be added in any order or combination.
- You can customise the interaction lines. In this case, the <referencePoints> element should be surrounded by <interactionLine> element.
- None of the customisation options within an <interactionLine> are compulsory.
- If you wish to configure several interaction lines, all of them have to be configured either as <interactionLine> or as <referencePoints>. You cannot mix <referencePoints> and <interactionLine>.
| Example from operational system 
|
...
