...
Attribute: id
Elements:
- description
- legendFontSize: Font size of legend
- axis TitleFontSize: Title font size
- tickLableFontSize: tick label font size
- tickTimeStep: to tie ticks to a time step (since 2018.02)
- synchronizeParameterAxis: synchronize the axis range of subplots displaying time series for the same parameter group (since 2018.02)
- visibilityGroup: defines order of the visibility groups in the drop down box (since 2019.02)
- subplot: see below for details
- plotViewerId & tableViewerId: to use alternative viewers for plot or tables
...
Attributes: name and id
Elements:
- description: Optional description
- nodeId
- viewPermission
- editPermission
- locationLoop
- types of display
- display: see below for details
- singleLocationDisplays Single location displays can be used to easily create plots for individual locations. This can either be done for individual locations, or alternatively for a locationSet which will then produce a list of location with their corresponding plot.
- singleParentLocationDisplays
- displayGroup: see below for details
- displayGroupId
...
| Info |
|---|
Display groups may be defined while DELFT-FEWS is running and reloaded by re-opening the time series dialogue.
If a mistake is made, then the shortcuts item to open the tree view will not appear and an appropriate message will be generated. After resolving the mistake the item will again become available on re-loading the display. |
plot
...
- subplot
Element of plot. Root element for each subplot. Multiple sub-plots may be defined per plot.
...
A horizontal bar is plotted for each time series. The color of the bars signify the value for that time series at the given time on the x-axis.
| Code Block |
|---|
| language | xml |
|---|
| title | horizontalColorCode example (click to expand) |
|---|
| linenumbers | true |
|---|
| collapse | true |
|---|
| <plot id="HorizontalColorCodePumps">
<description>testing the horizontal color code plots</description>
<subplot>
<subPlotType>horizontalColorCode</subPlotType>
<barMarginPercentage>30</barMarginPercentage>
<classBreaks>
<break lowerValue="0" color="green" label="off"/>
<break lowerValue="1" color="goldenrod" label="1 pump"/>
<break lowerValue="2" color="magenta" label="2 pumps"/>
<break lowerValue="3" color="aquamarine" label="3 pumps"/>
<break lowerValue="4" color="red"/>
</classBreaks>
<timeSeriesSet>
<moduleInstanceId>Preprocess_Units_HTMS</moduleInstanceId>
<valueType>scalar</valueType>
<parameterId>PO_BFN</parameterId>
<locationId>BFN Tower 1</locationId>
<locationId>BFN Tower 2</locationId>
<locationId>BFN Tower 3</locationId>
<locationId>BFN Tower 4</locationId>
<locationId>BFN Tower 5</locationId>
<locationId>BFN Tower 6</locationId>
<locationId>BFN Tower 7</locationId>
<timeSeriesType>simulated forecasting</timeSeriesType>
<timeStep unit="hour" multiplier="1"/>
<readWriteMode>read only</readWriteMode>
</timeSeriesSet>
</subplot>
</plot> |
| 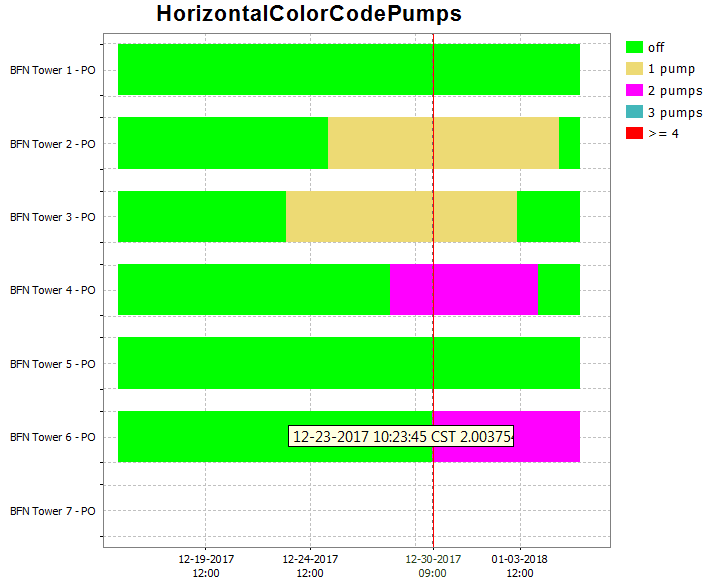 Image Modified Image Modified
|
leftAxis and rightAxis
...
Use the <area> element in combination with a <lineStyle> to obtain vertical lines.
| Code Block |
|---|
| language | xml |
|---|
| title | area example (click to expand) |
|---|
| linenumbers | true |
|---|
| collapse | true |
|---|
| <subplot>
<area>
<lineStyle>solid</lineStyle>
<lineWidth>10</lineWidth>
<color>blue</color>
<opaquenessPercentage>50</opaquenessPercentage>
<timeSeriesSet>
<moduleInstanceId>ImportMSW</moduleInstanceId>
<valueType>scalar</valueType>
<parameterId>Q.m</parameterId>
<locationId>H-MS-LUIK</locationId>
<locationId>H-MS-SINT</locationId>
<timeSeriesType>external historical</timeSeriesType>
<timeStep unit="hour"/>
<relativeViewPeriod unit="day" start="-2" end="0"/>
<readWriteMode>read only</readWriteMode>
</timeSeriesSet>
</area>
</subplot>
|
|  Image Modified Image Modified
|
clusteredBars
This option makes it possible to cluster bars per timestep. The config example below shows how clustered bars are displayed and configured:
| Code Block |
|---|
| language | xml |
|---|
| title | clusteredBars example (click to expand) |
|---|
| linenumbers | true |
|---|
| collapse | true |
|---|
| <displayGroup name="bars">
<display name="clusteredBars">
<subplot>
<clusteredBars axis="left">
<bar>
<color>blue</color>
<visibleInLegend>false</visibleInLegend>
<visibleInPlot>false</visibleInPlot>
<timeSeriesSet>
<moduleInstanceId>Import</moduleInstanceId>
<valueType>scalar</valueType>
<parameterId>H.m</parameterId>
<locationId>LocA</locationId>
<timeSeriesType>external historical</timeSeriesType>
<timeStep unit="hour"/>
<relativeViewPeriod unit="hour" start="-12" end="12"/>
<readWriteMode>editing visible to all future task runs</readWriteMode>
</timeSeriesSet>
</bar>
<bar>
<color>red</color>
<visibleInTable>false</visibleInTable>
<label>Rated Discharge</label>
<timeSeriesSet>
<moduleInstanceId>Import</moduleInstanceId>
<valueType>scalar</valueType>
<parameterId>Q.m</parameterId>
<locationId>LocA</locationId>
<timeSeriesType>external historical</timeSeriesType>
<timeStep unit="hour"/>
<relativeViewPeriod unit="hour" start="-12" end="12"/>
<readWriteMode>editing visible to all future task runs</readWriteMode>
</timeSeriesSet>
</bar>
</clusteredBars>
</subplot>
</display> |
|  Image Modified Image Modified
|
variableLineWidth
Type of plot that can use variable line width's for different graphs. See screenshot below of plot for different ensemble members with different line width's. In this case line width is an indication of the probability of the ensemble member. The sum of probability of all ensemble members at a time is one. Selecting separate ensemble members will mark them with the color black.
...
| Code Block |
|---|
| language | xml |
|---|
| title | additionalTimeSeries example (click to expand) |
|---|
| linenumbers | true |
|---|
| collapse | true |
|---|
| <plot id="WATERBALANS_DAG_CAW">
<subplot stackPlot="true">
<lineStyle>bar</lineStyle>
<timeSeriesSet>
<moduleInstanceId>BalansAfvoergebieden</moduleInstanceId>
<valueType>scalar</valueType>
<parameterId>H.G.i.d</parameterId>
<locationSetId>AFVOERGEBIEDEN</locationSetId>
<timeSeriesType>external historical</timeSeriesType>
<timeStep unit="day" timeZone="GMT+1"/>
<relativeViewPeriod unit="day" start="-32" end="0"/>
<readWriteMode>read only</readWriteMode>
</timeSeriesSet>
<additionalTimeSeries name="*AFGB_NAAR*" separateSubPlot="true">
<locationFunctionEquals selected="@LOC_ID@" additional="@AFGB_NAAR@"/>
<timeSeriesSet>
<moduleInstanceId>ImportOpvlWater</moduleInstanceId>
<valueType>scalar</valueType>
<parameterId>Q.G.15</parameterId>
<locationSetId>OPVLWATER_SUBLOC_DEBIETEN</locationSetId>
<timeSeriesType>external historical</timeSeriesType>
<timeStep unit="minute" multiplier="15"/>
<relativeViewPeriod unit="hour" start="-70" end="0"/>
<readWriteMode>read only</readWriteMode>
</timeSeriesSet>
</additionalTimeSeries>
<additionalTimeSeries name="*AFGB_VAN*" separateSubPlot="true">
<locationFunctionEquals selected="@LOC_ID@" additional="@AFGB_VAN@"/>
<timeSeriesSet>
<moduleInstanceId>ImportOpvlWater</moduleInstanceId>
<valueType>scalar</valueType>
<parameterId>Q.G.15</parameterId>
<locationSetId>OPVLWATER_SUBLOC_DEBIETEN</locationSetId>
<timeSeriesType>external historical</timeSeriesType>
<timeStep unit="minute" multiplier="15"/>
<relativeViewPeriod unit="hour" start="-70" end="0"/>
<readWriteMode>read only</readWriteMode>
</timeSeriesSet>
</additionalTimeSeries>
</subplot>
</plot> |
| |
displayGroup
...
- locationLoop
By defining a location loop within a displayGroup, the display group will be created for each location of location set configured in the loop.
...
| Code Block |
|---|
| language | xml |
|---|
| title | locationLoop example (click to expand) |
|---|
| linenumbers | true |
|---|
| collapse | true |
|---|
|
	<displayGroup name="Validations Location Loop">
		<displayGroup name=" ">
			<locationLoop>
				<locationSetId>FloodingAreas</locationSetId>
				<includeChildren>true</includeChildren>
				<locationRelationId>L_AREA</locationRelationId>
				<locationRelationId>L_VISIBILIY</locationRelationId>
				<locationRelationId>MEASUREMENT_PARENT</locationRelationId>
			</locationLoop>
			<displayGroup name="Waterbalance">
				<display name="Waterbalance">
					<plotId>Waterbalance</plotId>
				</display>
				<display name="Waterbalance incl. error">
					<plotId>Waterbalance_error</plotId>
				</display>
			</displayGroup>
                           ...
		</displayGroup>
</displayGroup> |
displayGroup - display
Definition of a pre-configured display. Each display may contain multiple sub-plots. Multiple displays may be defined per display group.
...
To tie the date/time ticks to the valid times of the (cardinal) time step, configure ‘tickTimeStep’ in DisplayGroups.xml. For example, if the ‘tickTimeStep’ is 6 hours then the ticks are always aligned with the synoptic times 00Z, 06Z, 12Z, 18Z. When we are zooming out and there is no space to display all date/times along the x-axis, then one or more synoptic times ticks are omitted. For example we see ticks at 00Z and 18Z.
displayGroup - singleLocationDisplays
Adds multiple displays at once to this display group. Every display will show only one location.
...
