...
Logarithmic axis can also be turned on and off manually, using the menu bar. If you do so, the setting will effect all subplots the same way. Should you wish to reset the subplots to the configured version, use the reset domain axis to configured button.
 Image Modified Image Modified
|  Image Modified Image Modified
|  Image Modified Image Modified
|
drawingOrderInverted
This option can be used to invert drawing order of the lines. By default the lines are drawn in the same order as shown in the legend : the first line first, the last line last. The last line is then on top. If drawing order is inverted the last line in the legend is drawn first and the first line last. The first line is then on top.
...
| Code Block |
|---|
| language | xml |
|---|
| title | chainageLocationSetId example (click to expand) |
|---|
| linenumbers | true |
|---|
| collapse | true |
|---|
| <plot id="Langsprofiel_Caspargouwse_Wetering">
<subplot>
<timeSeriesSet>
<moduleInstanceId>WerkFilter</moduleInstanceId>
<valueType>scalar</valueType>
<parameterId>H.G.15</parameterId>
<chainageLocationSetId>Langsprofiel_Caspargouwse_Wetering</chainageLocationSetId>
<timeSeriesType>external historical</timeSeriesType>
<timeStep unit="minute" multiplier="15"/>
<relativeViewPeriod unit="day" start="-32" end="0"/>
<readWriteMode>read only</readWriteMode>
</timeSeriesSet>
</subplot>
</plot>
<displayGroup name="LangsProfiel">
<display name="Langsprofiel_Caspargouwse_Wetering">
<locationSetId>Langsprofiel_Caspargouwse_Wetering</locationSetId>
<plotId>Langsprofiel_Caspargouwse_Wetering</plotId>
</display>
</displayGroup>
|
|  Image Modified Image Modified
|
domainParameterId
...
| Code Block |
|---|
| language | xml |
|---|
| title | domainParameterId example (click to expand) |
|---|
| linenumbers | true |
|---|
| collapse | true |
|---|
| <timeSeriesSet>
<moduleInstanceId>LMW_Import_spectrum</moduleInstanceId>
<valueType>scalar</valueType>
<parameterId>Wave.variancedensity.meting</parameterId>
<domainParameterId>f</domainParameterId>
<locationSetId>LMW_Czz10</locationSetId>
<timeSeriesType>external historical</timeSeriesType>
<timeStep unit="minute" multiplier="60"/>
<relativeViewPeriod unit="day" start="-2" end="2"/>
<readWriteMode>read only</readWriteMode>
</timeSeriesSet>
|
|  Image Modified Image Modified
|
Dual Domain Axis Time Series / 2D Polar Spectra plots
...
| Code Block |
|---|
| language | xml |
|---|
| title | domainParameterId example (click to expand) |
|---|
| linenumbers | true |
|---|
| collapse | true |
|---|
| <subplot>
<classBreaks>
<break symbolSize="10" color="000080" lowerValue="0"/>
<break symbolSize="10" color="0000A8" lowerValue="0.0005"/>
<break symbolSize="10" color="0000E6" lowerValue="0.001"/>
<break symbolSize="10" color="004DFF" lowerValue="0.0025"/>
<break symbolSize="10" color="00B3FF" lowerValue="0.005"/>
<break symbolSize="10" color="1AFFE5" lowerValue="0.01"/>
<break symbolSize="10" color="80FF80" lowerValue="0.015"/>
<break symbolSize="10" color="E6FF19" lowerValue="0.02"/>
<break symbolSize="10" color="FFB200" lowerValue="0.025"/>
<break symbolSize="10" color="FF4C00" lowerValue="0.035"/>
<break symbolSize="10" color="E50000" lowerValue="0.04"/>
<break symbolSize="10" color="A80000" lowerValue="0.045"/>
<break symbolSize="10" color="800000" lowerValue="0.05"/>
</classBreaks>
<direction>from</direction>
<timeSeriesSet>
<moduleInstanceId>Swan_dcsmv6_hirlam_forecast_import</moduleInstanceId>
<valueType>scalar</valueType>
<parameterId>Wave.variancedensity2D.voorspeld</parameterId>
<domainParameterId>f</domainParameterId>
<domainParameterId>dir</domainParameterId>
<locationSetId>SWAN_POINTS2</locationSetId>
<timeSeriesType>simulated forecasting</timeSeriesType>
<timeStep unit="minute" multiplier="60"/>
<relativeViewPeriod unit="day" start="-2" end="2"/>
<readWriteMode>read only</readWriteMode>
</timeSeriesSet>
</subplot>
|
|  Image Modified Image Modified
|
| Anchor |
|---|
| visibleInTable |
|---|
| visibleInTable |
|---|
|
visibleInTable, visibleInPlot
...
Adding descriptiveFunctions will result in an extra panel in the display, showing relevant descriptive information about the timeseries in view. More information on the descriptive functions available can be found at TimeSeriesDisplayConfiguration
 Image Modified
additionalTimeSeries
...
| Code Block |
|---|
| language | xml |
|---|
| title | showAsVerticalProfile example (click to expand) |
|---|
| linenumbers | true |
|---|
| collapse | true |
|---|
| <plot id="waterQuality">
<subplot>
<line>
<color>blue</color>
<lineStyle>solid;thick</lineStyle>
<markerStyle>square</markerStyle>
<timeSeriesSet>
<moduleInstanceId>ProcessObservedWaterquality</moduleInstanceId>
<valueType>scalar</valueType>
<parameterId>WT_obs</parameterId>
<locationId>R_401027</locationId>
<timeSeriesType>external historical</timeSeriesType>
<timeStep unit="hour" multiplier="3"/>
<readWriteMode>read only</readWriteMode>
</timeSeriesSet>
</line>
</subplot>
<subplot>
<line>
<color>turquoise</color>
<lineStyle>solid;thick</lineStyle>
<markerStyle>square</markerStyle>
<timeSeriesSet>
<moduleInstanceId>ProcessObservedWaterquality</moduleInstanceId>
<valueType>scalar</valueType>
<parameterId>EC_obs</parameterId>
<locationId>R_401027</locationId>
<timeSeriesType>external historical</timeSeriesType>
<timeStep unit="hour" multiplier="3"/>
<readWriteMode>read only</readWriteMode>
</timeSeriesSet>
</line>
</subplot>
<subplot>
<line>
<color>cyan</color>
<lineStyle>solid;thick</lineStyle>
<markerStyle>square</markerStyle>
<timeSeriesSet>
<moduleInstanceId>ProcessObservedWaterquality</moduleInstanceId>
<valueType>scalar</valueType>
<parameterId>pH_obs</parameterId>
<locationId>R_401027</locationId>
<timeSeriesType>external historical</timeSeriesType>
<timeStep unit="hour" multiplier="3"/>
<readWriteMode>read only</readWriteMode>
</timeSeriesSet>
</line>
</subplot>
<subplot>
<line>
<color>forest green</color>
<lineStyle>solid;thick</lineStyle>
<markerStyle>square</markerStyle>
<timeSeriesSet>
<moduleInstanceId>ProcessObservedWaterquality</moduleInstanceId>
<valueType>scalar</valueType>
<parameterId>Turbidity_obs</parameterId>
<locationId>R_401027</locationId>
<timeSeriesType>external historical</timeSeriesType>
<timeStep unit="hour" multiplier="3"/>
<readWriteMode>read only</readWriteMode>
</timeSeriesSet>
</line>
</subplot>
<subplot>
<line>
<color>green3</color>
<lineStyle>solid;thick</lineStyle>
<markerStyle>square</markerStyle>
<timeSeriesSet>
<moduleInstanceId>ProcessObservedWaterquality</moduleInstanceId>
<valueType>scalar</valueType>
<parameterId>DO_obs</parameterId>
<locationId>R_401027</locationId>
<timeSeriesType>external historical</timeSeriesType>
<timeStep unit="hour" multiplier="3"/>
<readWriteMode>read only</readWriteMode>
</timeSeriesSet>
</line>
</subplot>
<subplot>
<line>
<color>goldenrod</color>
<lineStyle>solid;thick</lineStyle>
<markerStyle>square</markerStyle>
<timeSeriesSet>
<moduleInstanceId>ProcessObservedWaterquality</moduleInstanceId>
<valueType>scalar</valueType>
<parameterId>DO%_obs</parameterId>
<locationId>R_401027</locationId>
<timeSeriesType>external historical</timeSeriesType>
<timeStep unit="hour" multiplier="3"/>
<readWriteMode>read only</readWriteMode>
</timeSeriesSet>
</line>
</subplot>
</plot>
<displayGroup id="waterquality" name="water quality">
<display id="WQ_R_401027" name="401027 WT, EC, pH, Turbidity, DO">
<relativeViewPeriod unit="hour" start="-336" end="168"/>
<locationId>R_401027</locationId>
<plotId>waterQuality</plotId>
<showAsVerticalProfile>true</showAsVerticalProfile>
</display>
</displayGroup>
|
| 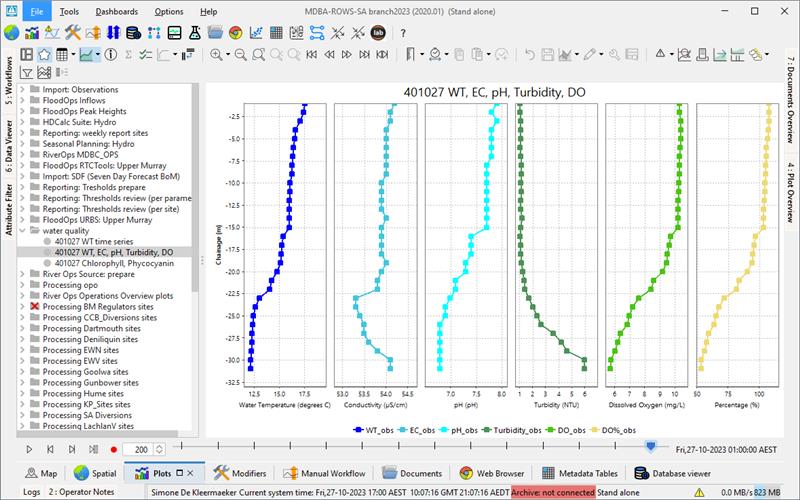 Image Modified Image Modified
|
showAsScatterPlot
To plot time series, with the values of the different time series on the X and Y axis. - <referencePoints> can be defined in several ways:
- <point> will be shown as an interaction line.
- <xAttributeId>, <yAttributeId> defining the x and y coordinates of the points, the y-coordinates.
Time dependent location attributes are not supported.
- <interactionLine>
- Any number of interaction lines can be added to the plot.
- Lines configured with points or location attributes can be added in any order or combination.
- You can customise the interaction lines.
In this case, the <referencePoints> element should be surrounded by <interactionLine> element. - None of the customisation options within an <interactionLine> are compulsory.
- If you wish to configure several With multiple interaction lines, all of them have to should be configured as either as <interactionLine> interactionLine or as <referencePoints>referencePoints.
You cannot mix <referencePoints> and <interactionLine>.
| Example from operational system 
|
...
With the elements <xAxisRange> and <yAxisRange> the range of the x and y axis can be defined.
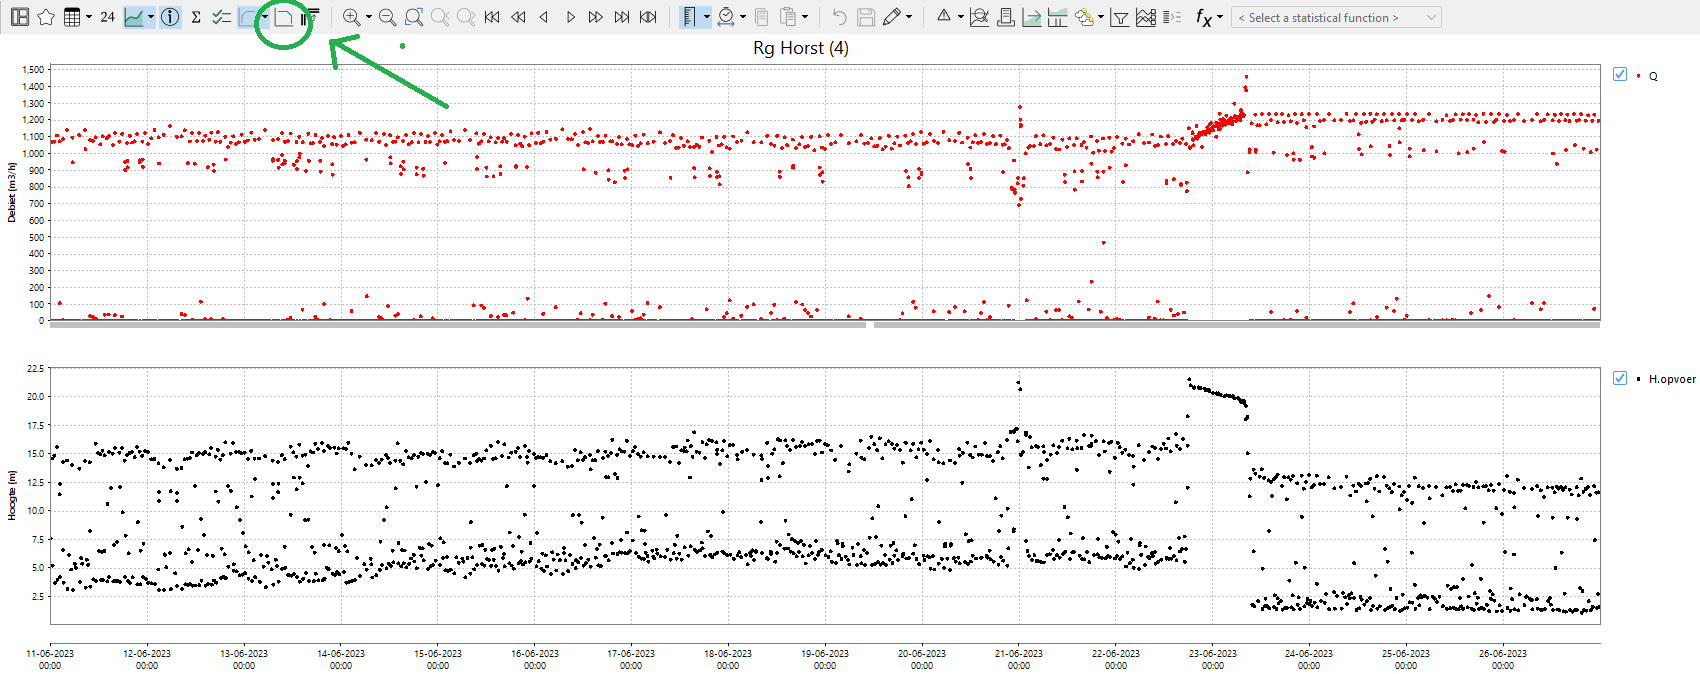 Image Modified
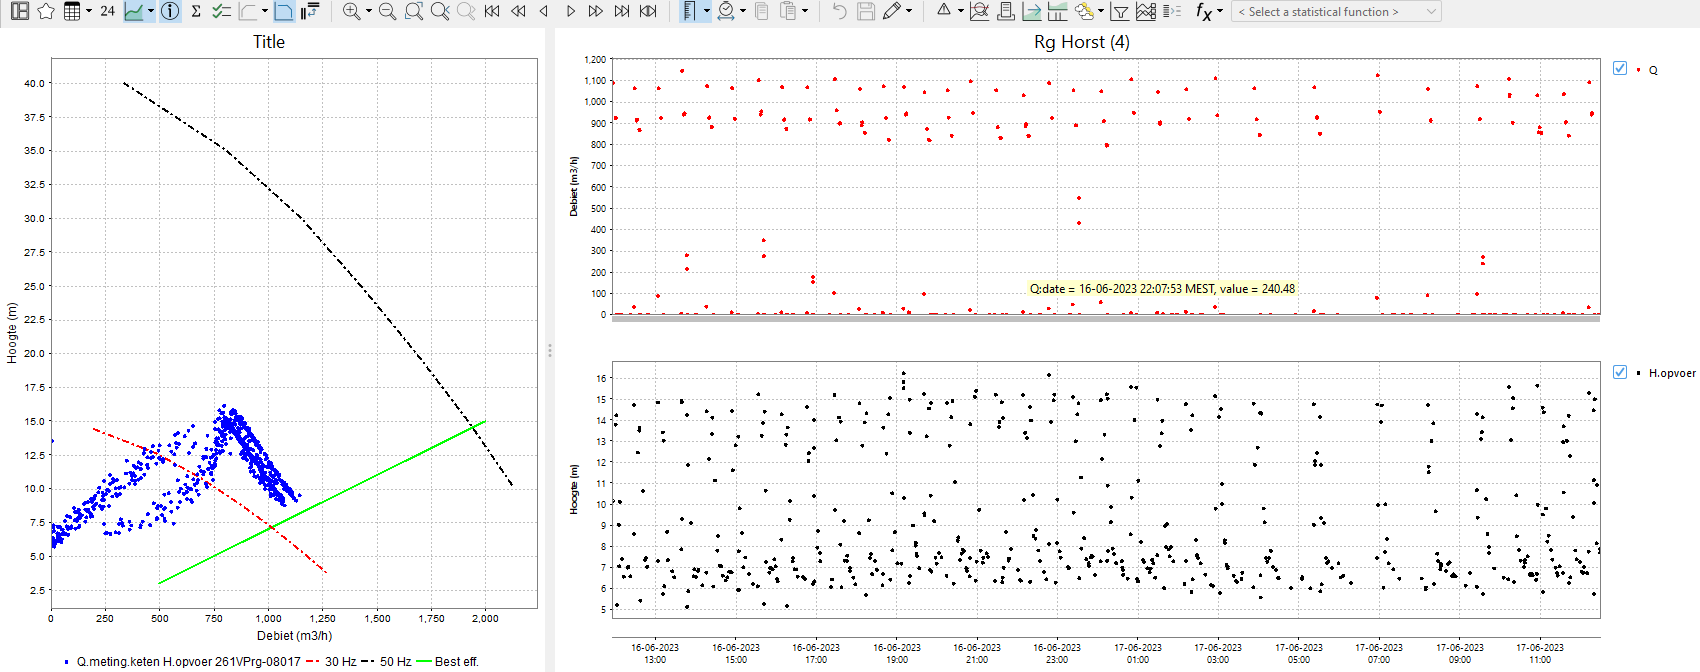 Image Modified
Pairing of time series
...