Five configuration files are involved to enable the peak heights functionality:
- Topology (RegionConfigFiles)
It lists all the peak height stations for which the correlation display should be shown. Only the forecast stations (mostly the downstream locations) should be listed. When a station for which a peak heights relation exist is listed in the forecast tree, the correlation display is automatically activated. - DisplayGroups (RegionConfigFiles)
The DisplayGroup file contains a list with related locations for each Peakheights station as defined in Topology, with reference to a defined display (plotId). - TravelTimes configuration (TravelTimesFiles)
A station can sometimes appear as forecast location (DS), sometimes as support (US) location. One forecast location may be correlated with multiple support locations. All support parameters for a single forecast location must have the same parameters. It is important to check that a locationId has the same name attached at all occurrences in the TravelTimeSets configuration file. Having multiple names for the same locationId will result in an error in the Delft-FEWS GUI. - CorrelationEventSets (CorrelationEventSetsFiles)
Definition of the events used in establishing a correlation between locations - CorrelationDisplay (DisplayConfigFiles) - this wiki page
Links the correct CorreltationEvents and PeakheightsTravelTimes configuration files and set the type of matching to be used to link events (i.e. SelectionType). When the SelectionType is set the “combined” for the forecast location the behavior will be as follows:- Events are first matched on “eventId” and if these are missing, matching takes additionally place based on “travel time” (OR relation).
- Events that have a mismatch based on travel time, but do have an EventId match will be part of the selection.
- Events that have a match based on travel time, but do not have an EventId match will be part of the selection.
The selection in the GUI can be refined using the filter options in the display.
...
| Anchor | ||||
|---|---|---|---|---|
|
| Anchor | ||||
|---|---|---|---|---|
|
...
The Id of the correlation display is identified in the DisplayInstanceDescriptors. When available on the file system, the name of the XML file for configuring the display with an Id of e.g. LookupDisplay Correlationdisplay is for example:
LookupDisplay Correlationdisplay 1.00 default.xml
LookupDisplay Correlationdisplay | File name for the LookupDisplay Correlationdisplay configuration |
1.00 | Version number |
default | Flag to indicate the version is the default configuration (otherwise omitted). |

Figure 153 Root elements of the configuration display configuration.
inputTimeSerieInfo
TimeSeriesSet defined for the input data. This time series set is used when applying the correlation established to a complete hydrograph.
eventSetsDescriptorId
Id of the correlationEventSets to be used in the display. The event set must be defined in the CorrelationEventSetsDescriptors CorrelationEventSets configuration (See regional CorrelationEventSetsFiles\ Configuration).
travelTimesDescriptorId
Id of the travelTimesDescriptor travelTimes to be used in the display. The mimimum and maximum allowed travel times set must be defined in the TravelTimesDescriptors travelTimes configuration (See regional TravelTimesFiles\ Configuration).
outputTimeSerieInfo
TimeSeriesSet defined for the output data. This time series set is used only for displaying the temporary time series to be displayed when applying the correlation established to a complete hydrograph. This time series is not saved in the database.
correlationDisplayOptions
Root element of options element for setting line colours in the scatter plot.
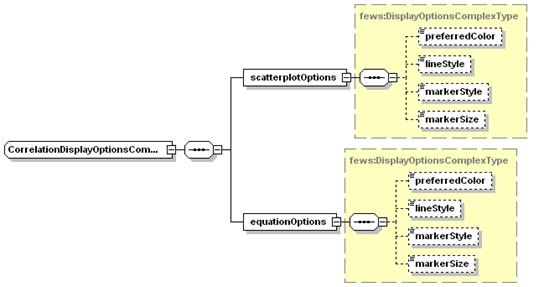
Figure 154 Elements of the scatterplot item in the CorrelationDisplay configuration
scatterplotOptions
Options for setting the properties of the scatter plot. The lineStyle of the scatter plot is "none" by definition (need not be defined).
Thresholds can be made invisible by configuring <thresholds visible"false/> this will apply to scatter plot as well as travel times plot.
equationOptions
Options for setting the properties of the regression line determined with the equation established.
preferredColor
Preferred colour for plotting scatter plot / regression line. For enumeration see timeSeriesDisplay Configuration in System Configuration.
markerStyle
Marker style for scatter plot / regression line. For enumeration see timeSeriesDisplay Configuration in System Configuration.
markerSize
Marker size for scatter plot / regression line in points.