...
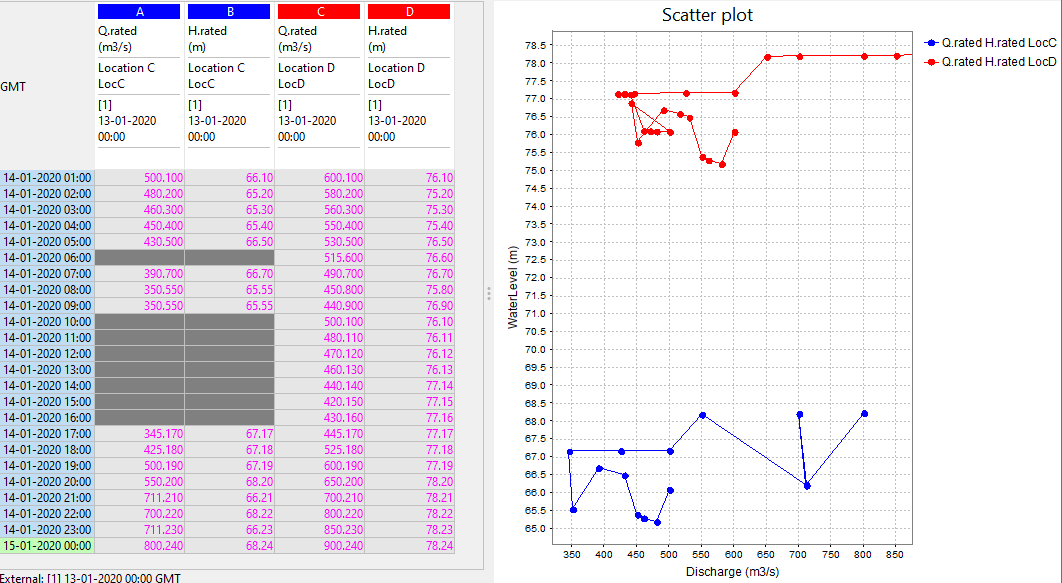
A simple scatter plot , without any additional optionoptions, is shown below :
An example of scatter plot configuration that uses all optional elements:
| Code Block |
|---|
<showAsScatterPlot>
	<chartTitle>Show As Scatter Plot</chartTitle>
	<referencePoints>
		<point>
			<x>0</x>
			<y>60</y>
		</point>
		<point>
			<x>500</x>
			<y>60</y>
		</point>
		<point>
			<x>1000</x>
			<y>70</y>
		</point>
		<point>
			<x>1500</x>
			<y>75</y>
		</point>
	</referencePoints>

	<referencePointsLegendLabel>reference points</referencePointsLegendLabel>

	<coloredBackgroundArea>
	    <label>area 1</label>
	    <color>cyan</color>
	    <opaquenessPercentage>50</opaquenessPercentage>
		<point>
			<x>10</x>
			<y>40</y>
		</point>
		<point>
			<x>10</x>
			<y>80</y>
		</point>
		<point>
			<x>1000</x>
			<y>80</y>
		</point>
		<point>
			<x>1000</x>
			<y>10</y>
		</point>
	</coloredBackgroundArea>
	<coloredBackgroundArea>
	    <label>area 2</label>
	    <color>green</color>
	    <opaquenessPercentage>50</opaquenessPercentage>
		<point>
			<x>100</x>
			<y>20</y>
		</point>
		<point>
			<x>100</x>
			<y>70</y>
		</point>
		<point>
			<x>2000</x>
			<y>20</y>
		</point>
	</coloredBackgroundArea>

	<xAxisRange>
		<min>-100</min>
		<max>1600</max>
	</xAxisRange>
	<xAxisTitle>X axis title</xAxisTitle>

	<yAxisRange>
		<min>40</min>
		<max>90</max>
	</yAxisRange>
	<yAxisTitle>Y axis title</yAxisTitle>

	<overrulingSeriesLabel>Series 1</overrulingSeriesLabel>
	<overrulingSeriesLabel>Series 2</overrulingSeriesLabel>

	<matchTimeSeriesPair>location</matchTimeSeriesPair>  <!-- the options are:  location, parameter -->
    <markerVisibility>onlyLast</markerVisibility>   <!-- the options are:  all, none, onlyLast -->
</showAsScatterPlot> |
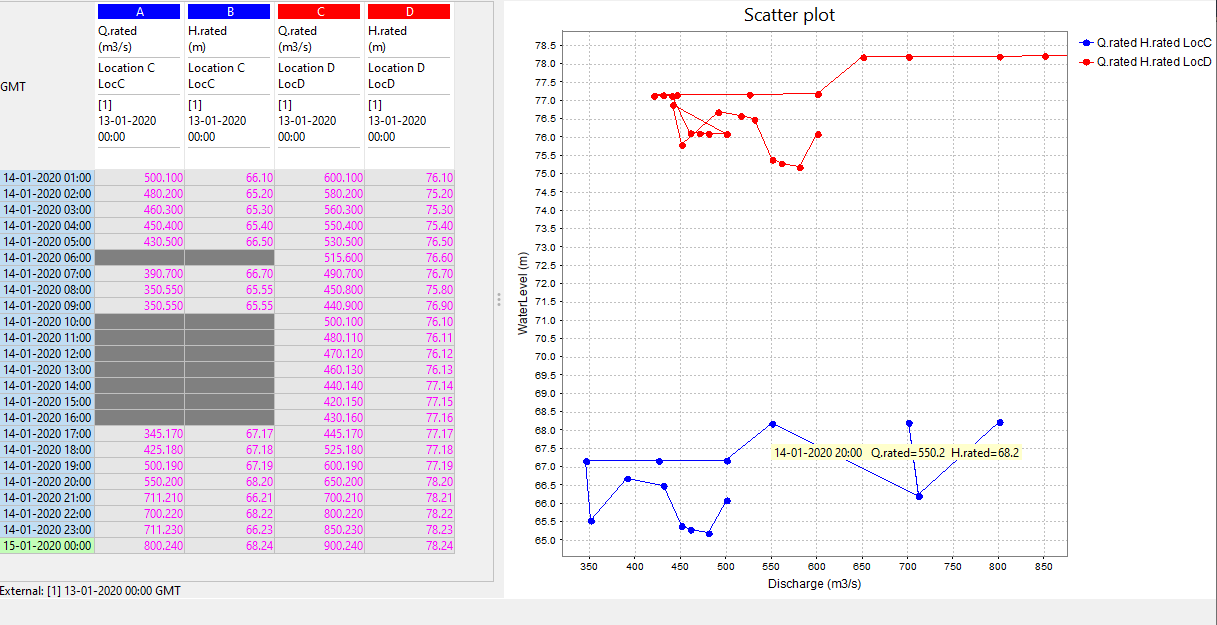
An example of the scatter plot created with the configuration above :

statisticalFunctionId to create a preconfigured display
...