...
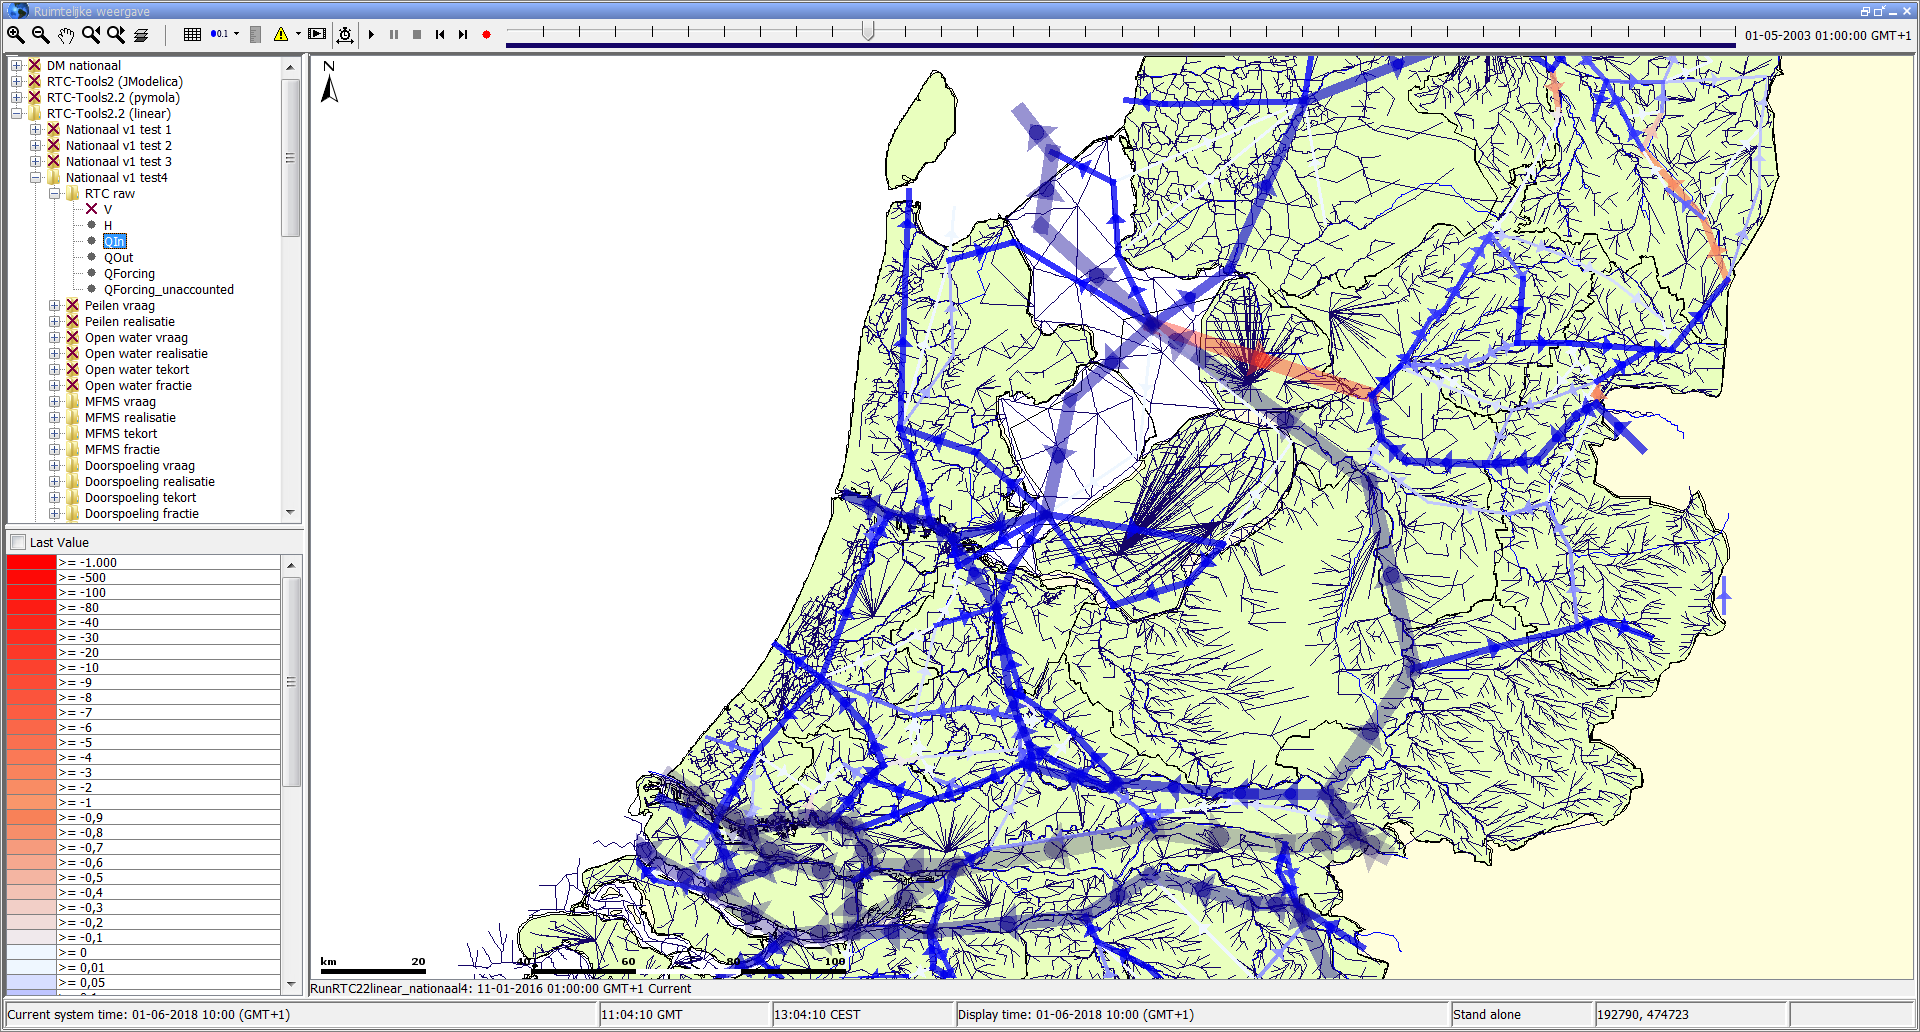
This element is available since 2018.01, in combination with a dataLayer containing a timeSeriesSet element. If this is set to true (false by default) and the locationSet in the timeSeriesSet contains (poly)-lines, the lines drawn in the spatial display will include directional arrows. If the time series has a positive value for a line, the arrow will point from the start of the line (first point found in the shape file) to the end of the line (second point found in the shape file). If the value is negative, the arrow is inverted. See the figures for examples.

wmsLayer
Use this option to show an animated wms layer which will be downloaded from a WMS server.
Configuring the wms layer is very similar to how a static background wms layer is configured in the geoMap.
To be able to animate the wms layer over time, some additional config elements are needed:
- <dateTimeParameter> : used to specify how the time should be passed in the url when requesting (parts of) the wms layer from the server. The name attribute specifies the name of the time parameter, the format specifies the datetime format pattern used and the timeZone attribute can be used to specify in which timezone the time should be passed. For example <dateTimeParameter name="time" format="yyyy-MM-dd" timeZone="GMT"/> will result in "time=2019-05-17" being added to the request url (when that date is selected on the time slider).
- <timeStep> : the timeStep used when displaying the wms layer. You can find out the timestep supported by the WMS server for the layer you wish to animate by requesting its capabilities as described on the geoMap page.
- <relativeViewPeriod> : the view period over which the wms layer will be displayed. You can find out the period supported by the WMS server for the layer you wish to animate by requesting its capabilities as described on the geoMap page.
showThumbnailsPanel
If this is true, then the grid display shows the spatial thumbnails panel when this grid plot is selected. Otherwise the grid display will not show the spatial thumbnails panel when this grid plot is selected. Default is false. After this grid plot has been selected, the user can still switch on/off the spatial thumbnails panel manually, using the toggle button in the grid display.
...