...
Besides plotting a grid in the grid display, it is also possible to plot scalar data (Figure 10) and longitudinal profiles (figure 9).
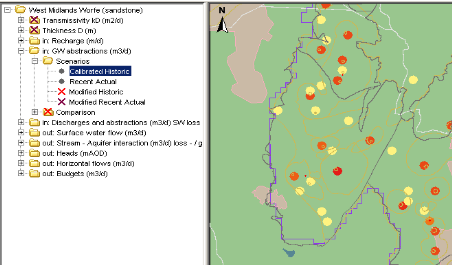

Figure 010 Example of a configuration of the scalar data in Grid Display

Figure 009 Example of a configuration of the longprofile in Grid Display

Figure 144 Root elements of the gridDisplay configuration
...
| Anchor | ||||
|---|---|---|---|---|
|
| Anchor | ||||
|---|---|---|---|---|
|
Figure 145 Elements of the configuration of class breaks
...
The background maps to be displayed are defined in the geoMap element. This is an XML implementation of the OpenMap configuration described also in Appendix C for configuring the main map display (in time this will also be done using the geoMap element).

Figure 146 Elements of the geoMap configuration
...