...
Definition of the time series set to be displayed in the selected grid plot. This can refer to one location with valuetype grid or longitudinal profile, or it can refer to a locationSet of scalars. Contourlines can only be displayed in combination with a regular grid.
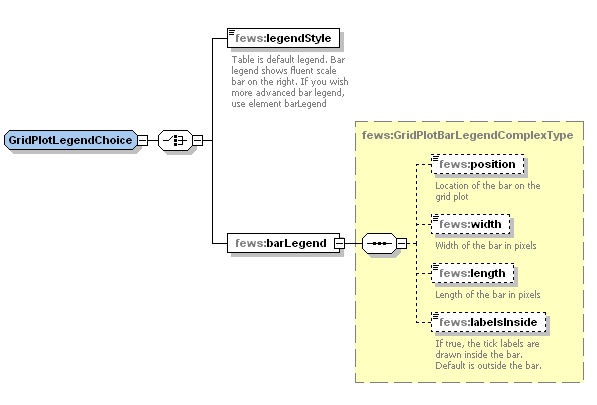
legendStyle
The legend can be shown as table legend or as bar legend.
Default legend style is table. Bar legend shows fluent scale bar on the right.
barLegend
Use this element to show customized bar legend.
The following legend properties can be changed:
- position: legend can be placed on the right, on the left, at the top or at the bottom. Default is on the right.
- width: width of the bar in pixels. Default is 40 pixels.
- length: length of the bar in pixels. The defaults are 400 for legend on the right/left, and for the legend at the top/bottom the length equals the width of the window
- labelsInside: if true , ticks and labels are displayed inside the legend bar . The default is outside.
Elements of the configuration of legend style
classBreaks
Definition of colours to use in displaying the dynamic grid. These are also shown in the legend on the left of the grid display (see example above).
...