What | Required | Description | schema location |
|---|---|---|---|
Grids.xml | no | Grid definitions, either regular or irregular |
DELFT-FEWS is a location oriented system. All time series data must be referenced to a (geographic) location. Scalar time series need no additional information. For grid time series data, each point in the grid must be referenced to a location in a grid structure.
Grids may be regular or irregular. In regular grids each cell has the same width, height and area within the coordinate system it is specified in.
In irregular grids the grid has a fixed number of rows and columns, but the cell height and width is not equal in each row and column. For these grids additional information is required on the location of each individual cell in the grid to allow display in the grids display as well as for use in the spatial interpolation routine.
When available on the file system, the name of the XML file is for example:
Grids 1.00 default.xml
Grids Fixed file name for the Grids configuration
1.00 Version number
default Flag to indicate the version is the default configuration (otherwise omitted).

Figure 28 Elements of the grids configuration
regular
Definition of a regular grid. One or more regular grids may be defined.
Attributes;
- locationId; location Id of the grid. This locationId must be included in the locations definition.
irregular
Definition of a irregular grid. One or more irregular grids may be defined.
Attributes;
- locationId; location Id of the grid. This locationId must be included in the locations definition.
Regular grids
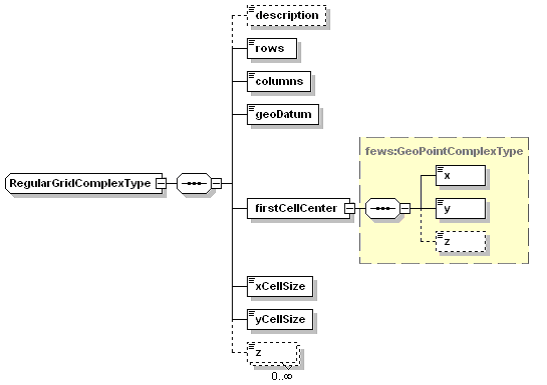
Figure 29 Elements of the Regular Grid in the Grids configuration
description
Optional description of the grid. Used only for reference purposes
rows, columns
Number of rows and columns in the grid
geoDatum
Coordinate system the grid is defined in. This may be a different coordinate system to that used in the main map display. The coordinate system may also differ per grid, as a grid may be regular in one coordinate system, but may be irregular in another. Defining the grid in the regular coordinate system is easier.
firstCellCenter
Coordinates of the center of the first grid cell. The convention in DELFT-FEWS is that this is the center point of the top left cell in the grid (Upper-Left).
firstCellCenter: x
Geographic coordinate of the first cell center point (Easting)
firstCellCenter: y
Geographic coordinate of the first cell center point (Northing)
firstCellCenter: z
Optional elevation of the first cell center point (Easting). If only this elevation is defined , then all cells in the grid are assumed to have the same elevation.
xCellSize / columnWidth
Cell width of each column in the grid. The cell width is given in the unit of the coordinate system referred to in the geoDatum. Generally this is metres, but in WGS 1984 this is decimal degrees.
The xCellSize-element is used when all cells are equal in width. Please use the columnWidth-element to define cells with variable columnWidth.
yCellSize / rowHeigt
Cell height of each row in the grid. The cell height is given in the unit of the coordinate system referred to in the geoDatum. Generally this is metres, but in WGS 1984 this is decimal degrees.
The yCellSize-element is used when all cells are equal in height. Please use the rowHeight-element to define cells with variable height.
z / zBottom / zTop
Optional definition of the elevation of each point in the grid. This definition is only necessary where a datum is required in for example 3-dimensional interpolation. This may be applied in for example interpolating temperature grids in high mountain areas. Alternative uses are the display of elevation in a cross section of the Spatial Display. The bottom/top layer is only displayed if the parameter unit is meters and if the corresponding displayOptions are configured in the TimeSeriesDisplayConfig file and if the layer contains non-NaN values. The useDatum property is not used here.
Use 'z' for the average elevation, and zBottom and zTop in case a model layer needs to be defined
zMapLayerName / zBottomMapLayerName / zTopMapLayerName
Optional definition of the elevation by reference to an ASC or BIL file stored in the MapLayerFiles-directory. This definition is only necessary where a datum is required in for example 3-dimensional interpolation. This may be applied in for example interpolating temperature grids in high mountain areas. Alternative uses are the display of elevation in a cross section of the Spatial Display. The bottom/top layer is only displayed if the parameter unit is meters and if the corresponding displayOptions are configured in the TimeSeriesDisplayConfig file and if the layer contains non-NaN values. The useDatum property is not used here.
Use 'zMapLayerNAme' for the average elevation, and zBottomMapLayerName and zTopMapLayerName in case a model layer needs to be defined.
Irregular grids

Figure 30 Elements of the irregular grid in the Grids configuration
description
Optional description of the grid. Used only for reference purposes
rows, columns
Number of rows and columns in the grid
geoDatum
Coordinate system the grid is defined in. This may be a different coordinate system to that used in the main map display. The coordinate system may also differ per grid. A grid may be regular in one coordinate system, but may be irregular in another. Defining the grid in the regular coordinate system is generally easier.
cellCentre
Definition of the cell centre points of all cells in the irregular grid. The number of cellCentre points defined must be the same as the number of cells in the grid (rows x columns).
cellCentre: x, cellCentre: y
Geographic coordinates of the ell centre point (x: Easting, y: Northing)
cellCentre: z
Elevation of the cell centre point.
examples
<irregular locationId="Swan2D_G2_cellcenters">
	<rows>1318</rows>
	<columns>317</columns>
	<esriShapeFile>
		<file>swan2D_G2_cellcenters.shp</file>
		<geoDatum>WGS 1984</geoDatum>
		<x>%X%</x>
		<y>%Y%</y>
	</esriShapeFile>
</irregular>
<irregular locationId="Swan2D_G2_cellcenters">
	<rows>1318</rows>
	<columns>317</columns>
	<esriShapeFile>
		<file>swan2D_G2_cellcenters.shp</file>
		<projectionFileAvailable>true</projectionFileAvailable>
		<x>%X%</x>
		<y>%Y%</y>
	</esriShapeFile>
</irregular>
<regular locationId="KNMI-HIRLAM-V70">
	<description>grid def. for KNMI-HIRLAM v7.0 with rotated pole</description>
	<rows>226</rows>
	<columns>136</columns>
	<rotatedSouthPole>
		<latitude>-30</latitude>
		<longitude>-15</longitude>
	</rotatedSouthPole>
	<gridCorners>
		<geoDatum>WGS 1984</geoDatum>
		<upperLeft>
			<x>-30.8688</x>
			<y>79.63847</y>
		</upperLeft>
		<lowerRight>
			<x>10.29617</x>
			<y>26.065</y>
		</lowerRight>
	</gridCorners>
</regular>
<regular locationId="WRF_CWB_Grid">
	<description>grid def. for imported WRF_CWB data</description>
	<rows>178</rows>
	<columns>148</columns>
	<geoDatum>WGS 1984</geoDatum>
	<firstCellCenter>
		<x>117.358656</x>
		<y>28.752274</y>
	</firstCellCenter>
	<xCellSize>0.048912529</xCellSize>
	<yCellSize>0.048912529</yCellSize>
</regular>
<regular locationId="QPF_LR">
		<description>QPF Grid for Long RangeABRFC</description>
	<rows>689</rows>
	<columns>1073</columns>
	<lambertConformalConic>
		<originLatitude>25.0</originLatitude>
		<originLongitude>265.0</originLongitude>
		<firstStandardParallelLatitude>25.0</firstStandardParallelLatitude>
		<secondStandardParallelLatitude>25.0</secondStandardParallelLatitude>
	</lambertConformalConic>
	<gridCorners>
		<geoDatum>WGS 1984</geoDatum>
		<upperLeft>
			<x>-130.13937712795388</x>
			<y>49.958437615088435</y>
			<z>0.0</z>
		</upperLeft>
		<lowerRight>
			<x>-69.19419381895221</x>
			<y>20.30332235930985</y>
			<z>0.0</z>
		</lowerRight>
	</gridCorners>
</regular>
<regular locationId="QPF">
	<description>QPF Grid for ABRFC</description>
	<rows>159</rows>
	<columns>335</columns>
	<polarStereographic>
		<originLatitude>90.0</originLatitude>
		<originLongitude>-105.0</originLongitude>
		<scaleAtOrigin>0.933</scaleAtOrigin>
		<equatorRadius>6367470.0</equatorRadius>
		<poleRadius>6367470.0</poleRadius>
	</polarStereographic>
	<gridCorners>
		<geoDatum>WGS 1984</geoDatum>
		<upperLeft>
			<x>-106.67471389477944</x>
			<y>39.37455858318055</y>
			<z>0.0</z>
		</upperLeft>
		<lowerRight>
			<x>-92.34455929643786</x>
			<y>32.390342856654044</y>
			<z>0.0</z>
		</lowerRight>
	</gridCorners>
</regular>