This page is under construction
This page is under construction
General
The dashboard display is used to view several displays side-by-side. For example, it can be used to view both a precipitation and a temperature grid plot side-by-side, synchronizing the time sliders. All users can create and modify their own dashboards, which will be stored in the user settings. Alternatively, a configurator can configure "predefined" dashboards which will be the same for all users. An example of a dashboard display is shown below.
TODO: add screenshot
Creating and modifying a Dashboard Display
Dashboard panels can be created and modified by the user to suit their needs.
Creating a new Dashboard
A new Dashboard can be created through the menu option of the dashboards menu in the FEWS menu bar:

You will then be prompted to enter a title for the new dashboard. The title will be used as the title of the tab for the panel, as well as for the menu item to (re)open the dashboard. The title needs to be unique.

After entering a title and confirming, a new (empty) dashboard panel will be opened and it will be added to the dashboards menu.
![]()
Adding Frames
Currently only the Spatial Display supports being added to a dashboard. Dashboard support for other displays could be added in the future.
To add a new Spatial Display frame to a dashboard, navigate to a Spatial Display and use the "Add to Dashboard" button found in the toolbar. Clicking this button will add a copy of the spatial display as a frame to the current open user-defined dashboard. If several user-defined dashboards are open, you will be prompted to choose a dashboard to which it will be added. If no user-defined dashboards are open, you will be asked to open a dashboard first. New frames can only be added to user-defined dashboards.

After adding a frame to a dashboard, the dashboard to which it was added will be automatically shown.

While it is possible to later modify the contents of the frame, for example, to select a different grid plot or change the accumulation, it is advisable to set these as you want them to be before adding a copy of the spatial display to the dashboard.
Modifying Frame Contents
Spatial Display frames will only show the map and plot. To gain access to the plot tree, accumulation slider and legend, a frame must be maximized. This can be done by clicking the maximize button on the frame, or double-clicking its title.

By maximizing a frame, its plot selection and accumulation can be changed. When restoring the frame to its original size (by clicking the restore button or double-clicking its title), the left panel will be hidden again.
Arranging the Frames
Dashboard frames can be resized as by dragging its border as you usually would. The dashboard menu also offers three options to aid in arranging the dashboard frames:
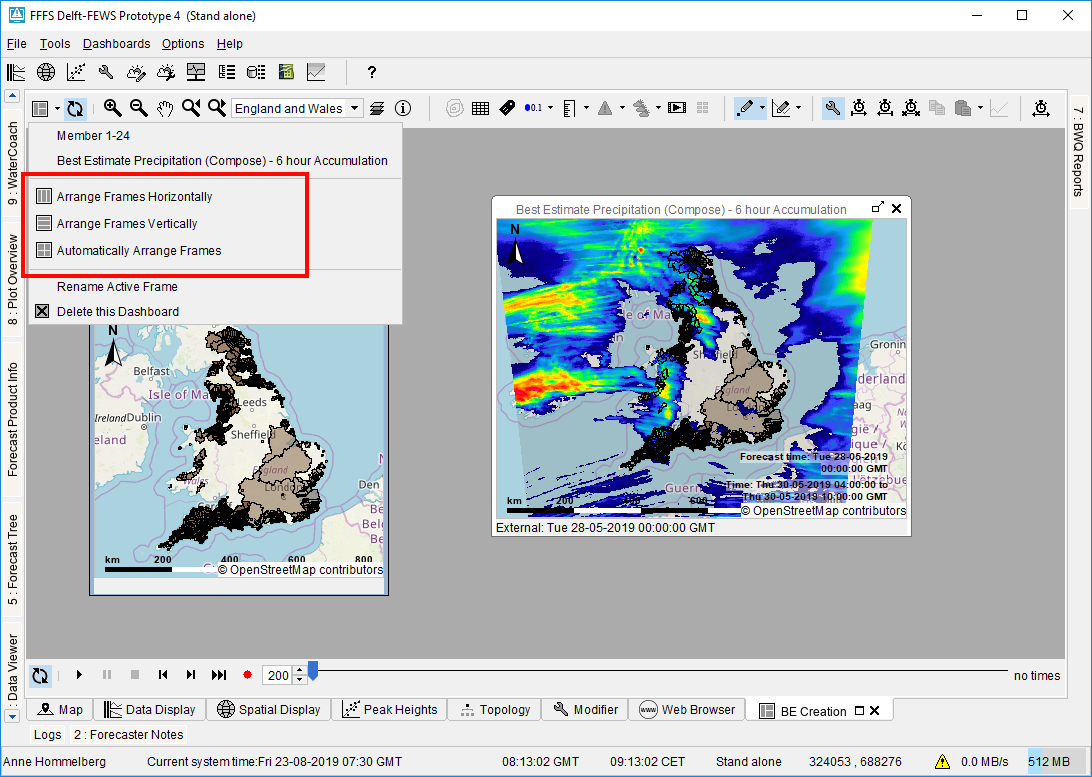
Arrange Frames Horizontally
This option will arrange all frames from left to right, giving each an equal amount of horizontal space. The frames will be kept in the same "left-to-right" order they are currently in.
Arrange Frames Vertically
This option will arrange all frames from top to bottom, giving each an equal amount of vertical space. The frames will be kept in the same "top-to-bottom" order they are currently in.
Arrange Frames Automatically
This option will move an scale the current desktop window to ensure all frames fit in it exactly, remove as much overlap between frames as possible, and finally remove as much empty space as possible. While doing so, it will always prefer the top frame to be made larger and the bottom frame to be made smaller. Examples for when this options will come in handy are:
- If you've resized the FEWS application / dashboard panel, several frames may have become (partially) invisible. The "Arrange Frames Automatically" would result in all frames being visible again.
- If you wish to arrange the frames in a different pattern than left to right or top to bottom.
- If you wish to resize one of your frames but doing so makes it overlap with the frame(s) next to it.
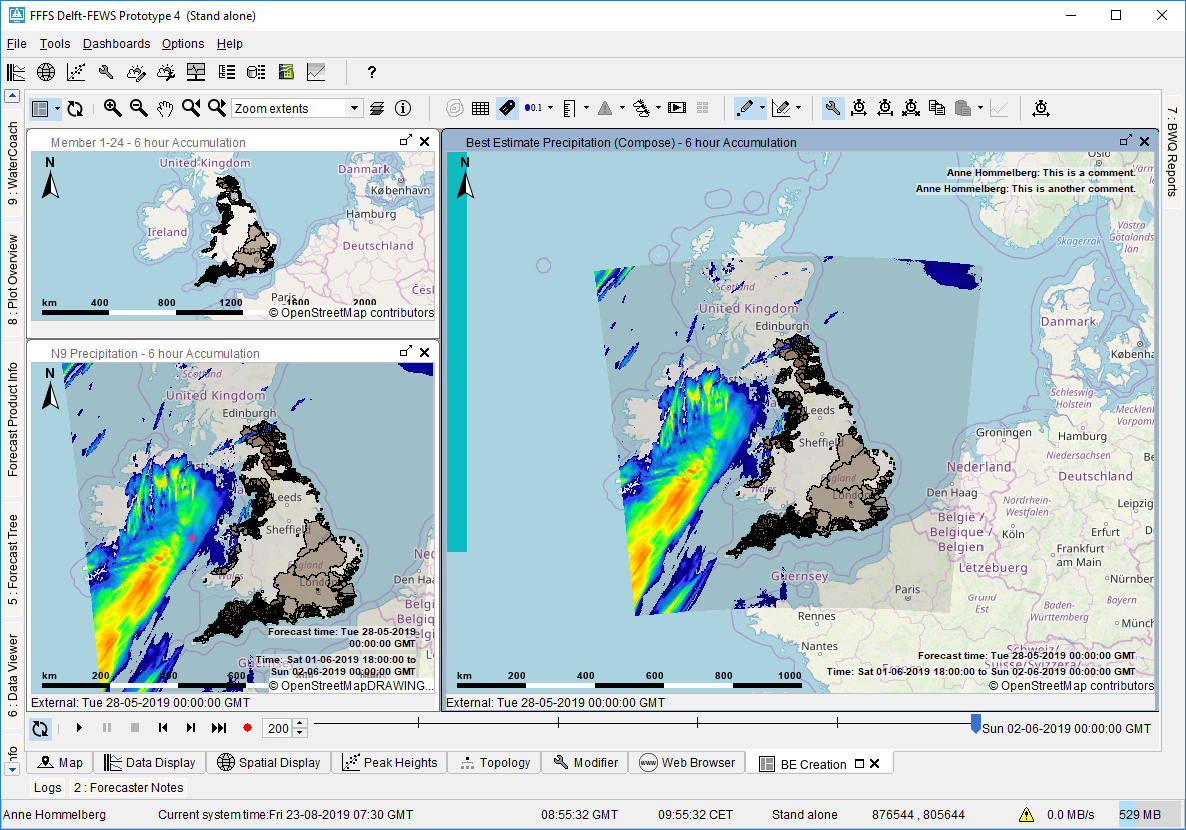
For example, the situation before using the "Arrange Frames Automatically" option is shown on the left while the result is shown on the right in the screenshots below:

Frame Titles
Deleting a dashboard
Using a Dashboard Display
Opening a Dashboard Display
Accessing the frame toolbars
Synchronizing Frames
Map Extent Synchronization
Time Slider Synchronization
User-defined vs. Predefined Dashboard Displays
TODO:
- explain debug menu options to turn user-defined into predefined and vice versa
- mention unavailable options for predefined dashboards (delete, rename etc.)
- explicitly mention all settings normally stored in user-settings are now in dashboards.ini therefore button status etc. will be reset when predefined dashboard is reopened.