Create a Plot Layout
Introduction
In the report phase usually a plot is created, in which data from the setup, measurement and analysis phase are reported in a graph or table.
The layout of the plot must be defined before a test can be plotted.
Steps
Startup/Open
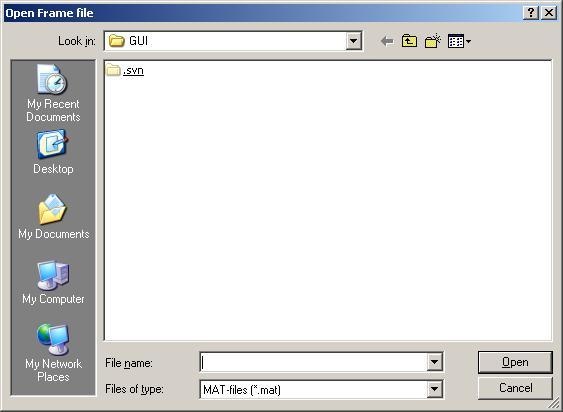
To edit an existing plot layout, start streamPlotSetup and choose the plot file concerned.

To create a new plot layout, press Cancel when being asked to open a Plot File. A dialog is shown to define the initial layout of the plot.

Explanation of the fields:
- Number of rows: (maximum) number of horizontal sections in the plot; this can be reset later on.
- Number of columns: (maximum) number of vertical sections in the plot; this can be reset later on.
Also a frame file can be chosen (optional).