1 Introduction
This document (HFPTforNFFS.pdf ) describes the Historic Forecast Performance Tool (HFPT) adapter which was first developed under Environment Agency R&D project SC080030 'risk based probabilistic flood forecasting' [[1]]. The original scientific name of the method is 'Quantile Regression' which was subsequently renamed to HFPT. This report includes a description of the Historic Forecast Performance Tool adapter that can be used within NFFS, the file formats for reading and writing of the quantiles, the configuration of the Historic Forecast Performance Tool adapter in NFFS. In addition, a limited background on the method is described. In Appendix A the off-line calibration module of the Historic Forecast Performance Tool is described.
The migration of the prototype R&D to the current version of the NFFS adaptor consists of several steps:
- Increase robustness module for operational purpose. This includes adding error handling and creation of log files, adding flags to module output/result files, module under subversion (SVN), simplified configuration (removing unnecessary items).
- Updating test configurations SC080030 for case studies developed under the R&D project.
- Documentation of configuration of the adapter in NFFS.
2 Role in NFFS
The role of the Historic Forecast Performance Tool is to provide a probability distribution of the water level forecasts (or flow) conditioned on the deterministic water level forecast (or flow forecast). This can one, a few or many or percentiles or quantiles (including median or any other percentile/quantile like 0.05, 0.10, 0.25, 0.50, 0.75, 0.95).
The Historic Forecast Performance Tool adapter is linked to NFFS by means of the general adapter (see Figure 2.1).
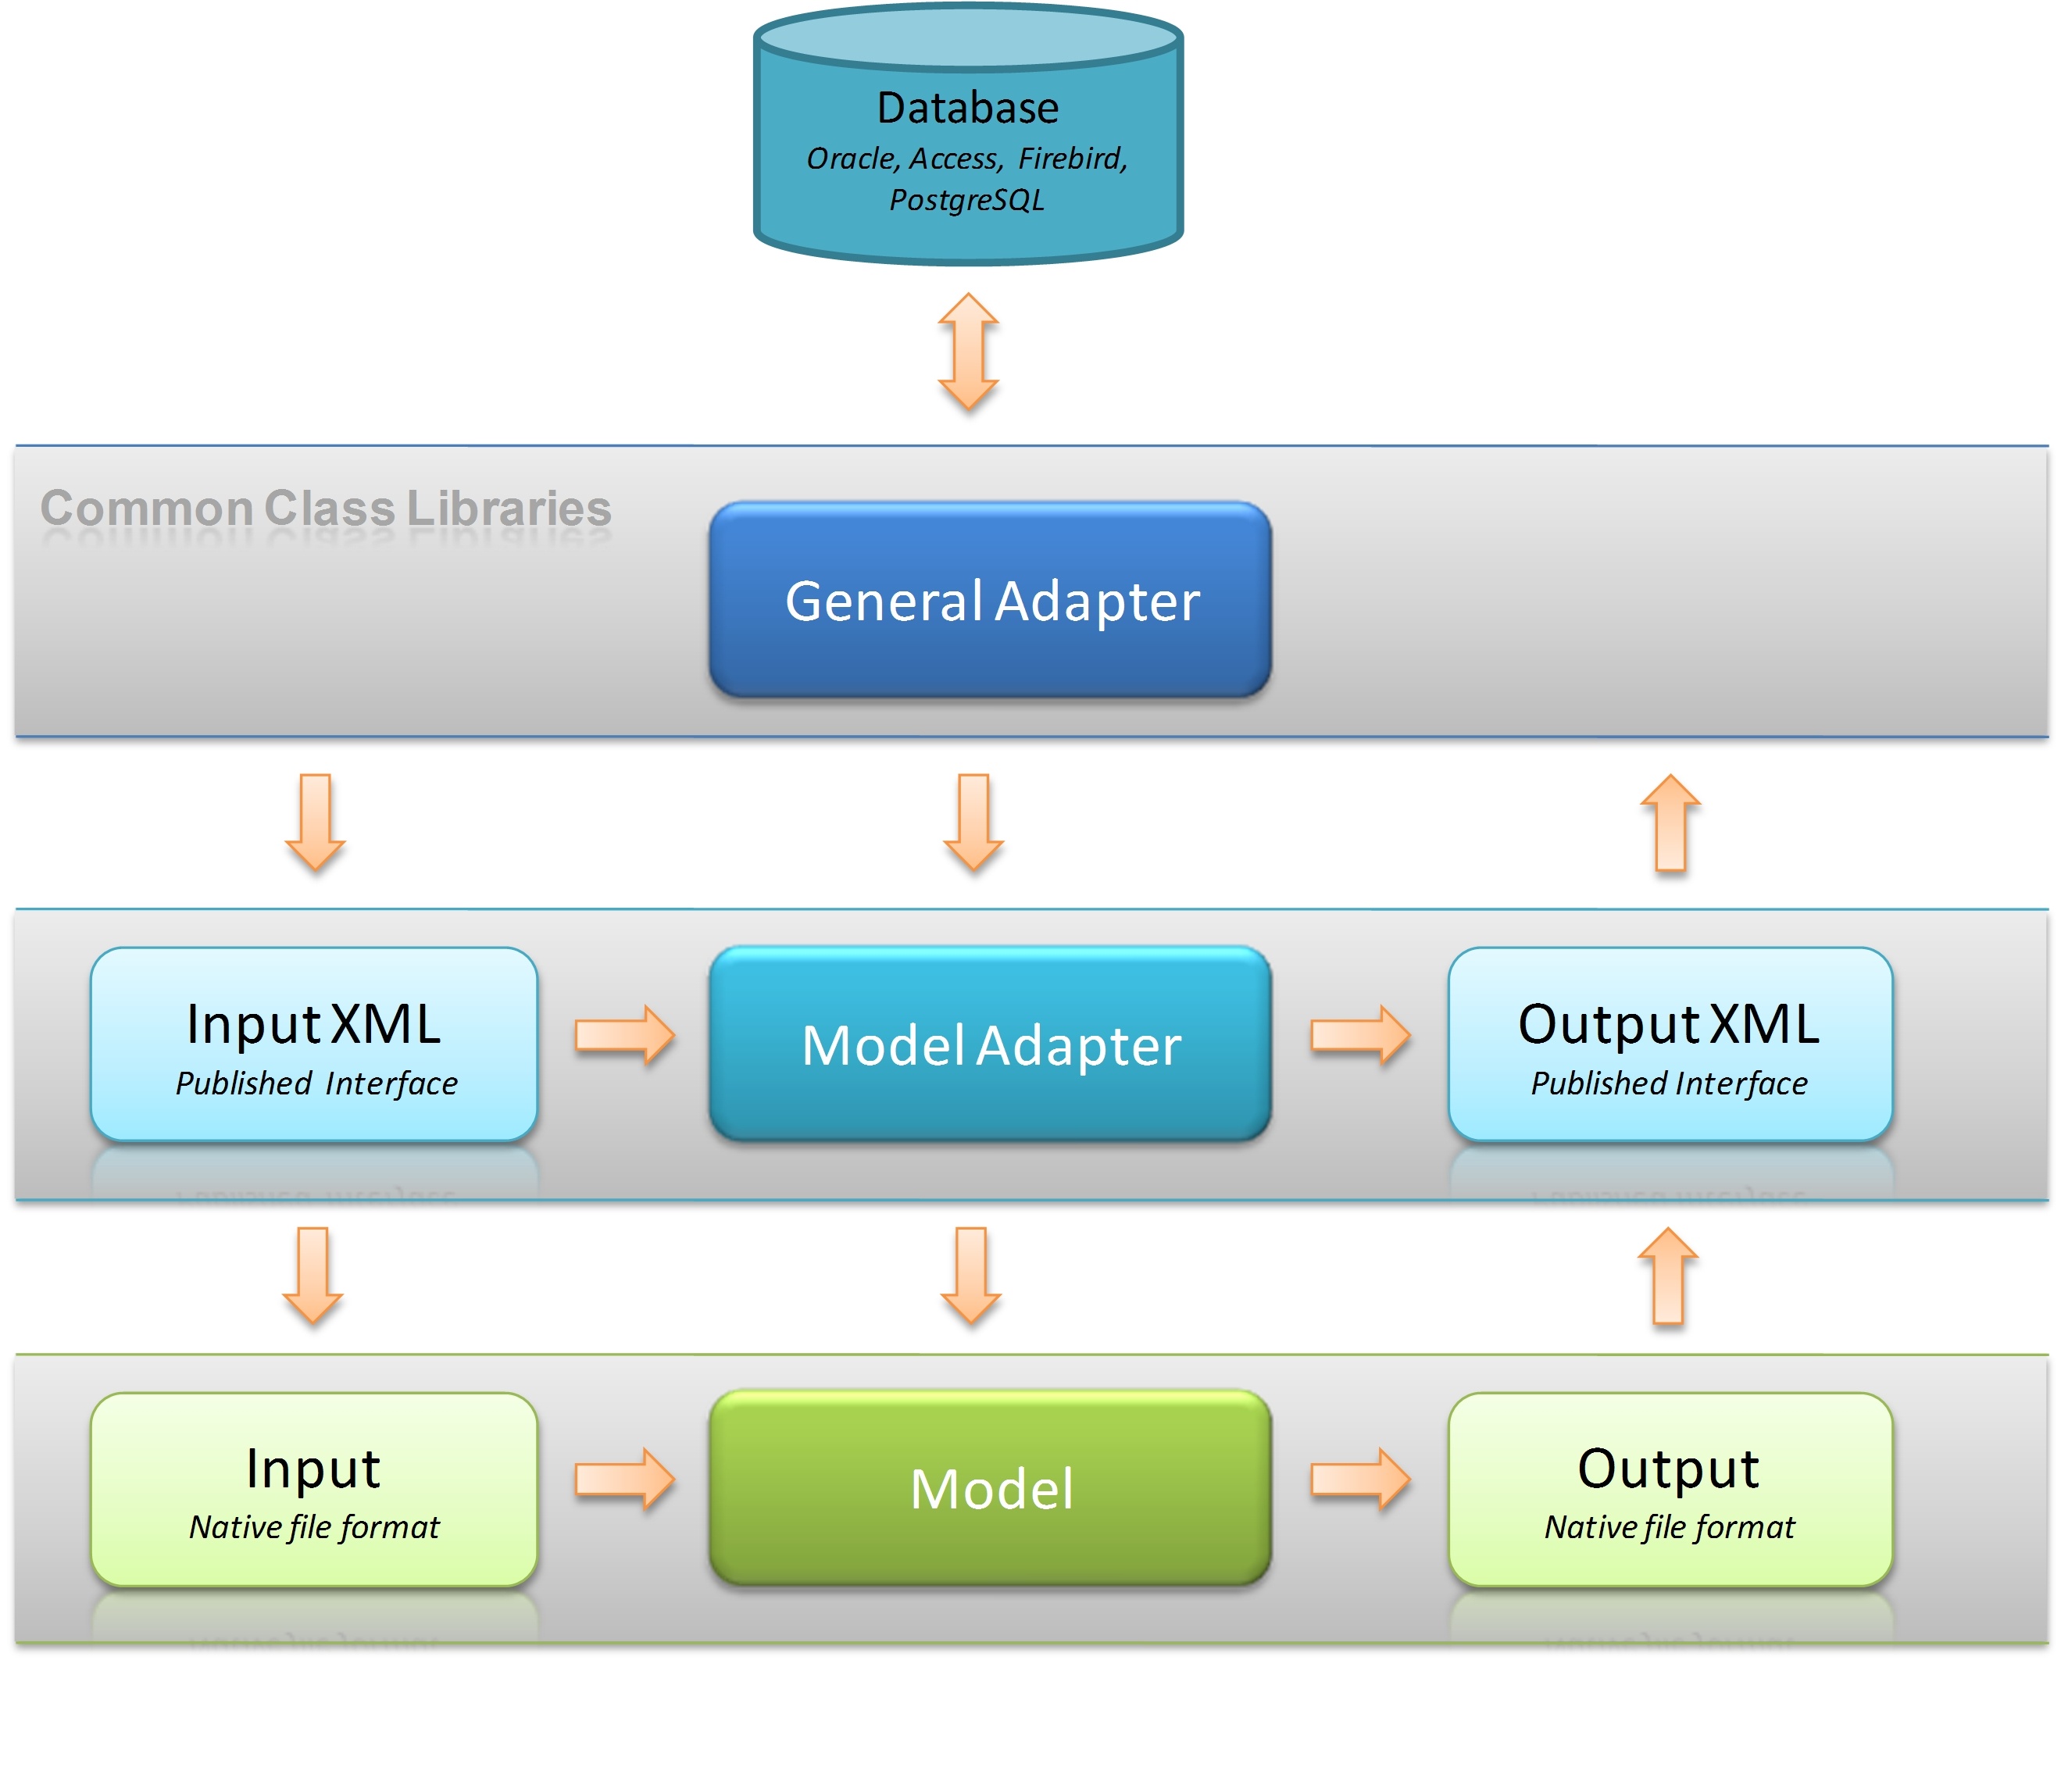
Figure 2.1 Schematic Interction between between Delft-FEWS and Historic Forecast Performance Tool adapter (see Werner et al., 2004, Weerts et al., 2010)
3 Method description
3.1 Historic Forecast Performance Tool
With increasing leadtime, many sources of uncertainty impact the accuracy of forecasts, with different uncertainty components dominating at different lead times. In an operational setting, forward propagation of all these uncertainties can be infeasible because it requires many data (e.g. meteorological ensemble forecasts) or many model runs (EA, 2011?).
The Historic Forecast Performance Tool (i.e. Quantile Regression) adapter as developed in R&D project SC080030 (see Weerts et al., 2011) makes use of offline-derived quantiles (median, quartiles, percentiles, etc) of the probability density function of the forecast error at different lead times (i.e. climatology of the forecast error at different lead times). The estimates of the quantiles of the forecast error are conditional on the (deterministic) water level forecast (or flow forecast) and leadtime. In real-time, based on the water level forecast and leadtime, the moment of the forecast error is looked up and added to the water level forecast (or flow forecast).
The Historic Forecast Performance Tool estimates the uncertainty due to all uncertainty sources affecting the forecast error. In NFFS (i.e. Delft-FEWS), the Historic Forecast Performance Tool is implemented as a post-processor on a deterministic forecast (see Figure 3.1).
Figure 3.1 Example Historic Forecast Performance Tool as postprocesser in NFFS
3.2 Calibration Quantile Regression relationships
The Historic Forecast Performance Tool is based on Quantile Regression that is a method for estimating conditional quantiles (Koenker, 2005; Koenker and Basset, 1978; Koenker and Hallock, 2001). This requires conditioning of the Quantile Regression relationships on a calibration dataset of forecast values and associated forecast errors at each leadtime of interest (see Appendix A). This calibration is carried out off-line and is described in more detail in Appendix A. The end result of the calibration are a number of files describing the QR relationships (see Figure 3.1) per leadtime containing a look up table of the percentiles/quantiles of the forecast error conditional on the water level forecast (or flow forecast).
Although, it is possible to estimate the QR relationships for each leadtime, this is in practise unfeasible. Therefore, an interpolation approach (linear) between the QR relationships of different leadtimes (i.e. assuming that the change in error characteristic between leadtimes is linear) is used. Depending on the response time of the catchments the lead-time interval between the estimated QR relationships may vary (1-2 hours vs 3 hours). For example, for Todmorden an interval of 2 hours is used while for the Upper-Severn an interval of 3 hours is used.
3.3 Content of QR relationships files
The QR relationships are contained in csv files. These csv files contains 2 + n columns, where n is the number of quantiles for which estimates are made. The file has a one-line header, which contains the names of the quantiles estimated. Each row contains a water level (or flow) value along with the additive error quantiles, the following columns are given per row:
column |
description |
1 |
Record number |
2 |
Hindcasted discharge or water level value at the given lead time (are ordered in ascending order) |
3 (n+2) |
Quantile error, belonging to the hindcasted value, given in the same row |
An example of the content of such a file is given below:
942 |
4.9666 |
-1.57933 |
-0.42273 |
-0.13417 |
0.146459 |
0.622485 |
943 |
5.03154 |
-1.5847 |
-0.42347 |
-0.1344 |
0.146697 |
0.623916 |
944 |
5.039295 |
-1.59015 |
-0.42417 |
-0.13444 |
0.147244 |
0.625369 |
945 |
5.071049 |
-1.59569 |
-0.42562 |
-0.13537 |
0.147856 |
0.627183 |
946 |
5.087218 |
-1.60132 |
-0.42711 |
-0.13711 |
0.148691 |
0.629604 |
947 |
5.098072 |
-1.60704 |
-0.42863 |
-0.13839 |
0.149717 |
0.632067 |
948 |
5.113213 |
-1.61287 |
-0.42952 |
-0.13907 |
0.15061 |
0.634572 |
949 |
5.129232 |
-1.62231 |
-0.4305 |
-0.13991 |
0.151202 |
0.637121 |
950 |
5.150331 |
-1.63292 |
-0.43171 |
-0.14068 |
0.151703 |
0.639716 |
951 |
5.15863 |
-1.64373 |
-0.43221 |
-0.14179 |
0.151718 |
0.641067 |
952 |
5.175358 |
-1.65474 |
-0.43394 |
-0.1433 |
0.151812 |
0.641883 |
953 |
5.176646 |
-1.66597 |
-0.43826 |
-0.14371 |
0.152727 |
0.642714 |
954 |
5.219848 |
-1.67742 |
-0.44298 |
-0.14486 |
0.153603 |
0.643563 |
955 |
5.232494 |
-1.6891 |
-0.45232 |
-0.14687 |
0.153829 |
0.644428 |
956 |
5.259691 |
-1.70103 |
-0.46806 |
-0.14825 |
0.154138 |
0.645962 |
957 |
5.271904 |
-1.71322 |
-0.47251 |
-0.14872 |
0.154948 |
0.648547 |
958 |
5.28762 |
-1.72569 |
-0.47522 |
-0.14922 |
0.156024 |
0.65119 |
4 Functionality HFPT Adapter
4.1 Introduction
The Historic Forecast Performance Tool adapter is written in R (R Development Core Team, 2010) and executed via running an R script in the general adapter (Weerts et al., 2010; Weerts et al., 2011). The R package can be downloaded from http://www.r-project.org/.
Besides the base R package the following R libraries/packages are needed
Hmisc
XML
zoo
quantreg
The Rscript.exe can be run via the General Adapter using command line arguments.
4.2 Configuration of the HFPT module in NFFS
4.2.1 global.properties
The R package contained in the ModuleDataSet files is exported and unzipped to the modules directory creating the directory %REGION_HOME%/Modules/R-2.13.0. In the global.properties files the location of the Rscript.exe must be defined as follows
R_EXE=%REGION_HOME%/Modules/R-2.13.0/bin/Rscript.exe
The location of the HFPT adapter is assumed to be under %REGION_HOME%/Modules/HFPT and this is also assumed to be the %ROOT_DIR%.
4.2.2 ModuleDataSets
The base package and the additional libraries are contained the directory named R-2.13.0 (+/-29Mb). This directory is stripped as much as possible from unnessary items like html and pdf files. However, because of limitations on the size of the ModuleDataSet files in NFFS, due to the use of weblogic (Boot, pers. comm.), the directory is split up into four ModuleDataSet files all smaller than 12 Mb. Resulting in four ModuleDataSet Files
R_part1_Module.zip
R_part2_Module.zip
R_part3_Module.zip
R_part4_Module.zip
The Retrieve_Zipped_Configurations.xml workflow exports all ModuleDataSet files by for example adding these lines to the Retrieve_Zipped_Configurations.xml file
<activity>
<runIndependent>true</runIndependent>
<moduleInstanceId>Midlands_US_HFPT_Modules</moduleInstanceId>
</activity>
would export the ModuleDataSets configured in the moduleInstance Midlands_US_HFPT_Modules. The same needs to be done the four ModuleDataSet files containing R.
The Midlands_US_HFPT_Modules file looks like
<?xml version="1.0" encoding="UTF-8"?>
<generalAdapterRun xmlns="http://www.wldelft.nl/fews" xmlns:xsi="http://www.w3.org/2001/XMLSchema-instance" xsi:schemaLocation="http://www.wldelft.nl/fews http://146.213.31.101/schemas/generalAdapterRun.xsd">
<general>
<description>Export modules directory</description>
<rootDir>%REGION_HOME%/Modules/</rootDir>
<workDir>%ROOT_DIR%</workDir>
<exportDir>%ROOT_DIR%</exportDir>
<exportDataSetDir>%ROOT_DIR%</exportDataSetDir>
<importDir>%ROOT_DIR%</importDir>
<dumpFileDir>$GA_DUMPFILEDIR$</dumpFileDir>
<dumpDir>%ROOT_DIR%</dumpDir>
<diagnosticFile>%ROOT_DIR%</diagnosticFile>
<convertDatum>false</convertDatum>
</general>
<activities>
<exportActivities>
<exportDataSetActivity>
<moduleInstanceId>Midlands_US_HFPT_Modules</moduleInstanceId>
</exportDataSetActivity>
</exportActivities>
</activities>
</generalAdapterRun>
Of course all the modules must be added to the ModuleInstanceDescriptors.XML file:
<moduleInstanceDescriptor id="R_part1_Module">
<description>Retrieves R_part1 zipped modules</description>
<moduleId>GeneralAdapter</moduleId>
</moduleInstanceDescriptor>
<moduleInstanceDescriptor id="R_part2_Module">
<description>Retrieves R_part2 zipped modules</description>
<moduleId>GeneralAdapter</moduleId>
</moduleInstanceDescriptor>
<moduleInstanceDescriptor id="R_part3_Module">
<description>Retrieves R_part3 zipped modules</description>
<moduleId>GeneralAdapter</moduleId>
</moduleInstanceDescriptor>
<moduleInstanceDescriptor id="R_part4_Module">
<description>Retrieves R_part4 zipped modules</description>
<moduleId>GeneralAdapter</moduleId>
</moduleInstanceDescriptor>
<moduleInstanceDescriptor id="Midlands_US_HFPT_Modules">
<description>Retrieves Midlands_US_HFPT_Modules</description>
<moduleId>GeneralAdapter</moduleId>
</moduleInstanceDescriptor>
4.2.3 Folder structure of HFPT module directory
The following folder structure is necessary and contained in the ModuleDataSet file
config
QR_models
• locationId[1]
• locationId[2]
• locationId[3]
• locationId[n]
Work
4.2.4 Location and file naming convention
Each QR relationships relationship is specific in terms of
• Forecast location
• Forecast leadtime
The folder location of each QR relationships for a specific location (2638 in this example) in our example would be as follows:
%ROOT_DIR%\HFPT\QR_models\2638
where 2638 specifies the locationId. The QR relationships are contained in comma-separated text files. The file naming convention, associated with the QR relationships should be
%ROOT_DIR%\Modules\HFPT\QR_models\2638\QR_2638*_LT*.csv
The string _LT means 'Lead Time' and is used to find the associated lead time with the error model. characters in between _LT and .csv indicate the lead time in hours (for example QR_2638_LT03.csv).
Example of Structure of Modules dir in NFFS
4.3 General Adapter Run
The Historic Forecast Performance Tool adapter is linked to NFFS by means of the general adapter (see Figure 2.1).
4.3.1 Header
The T0 is used by the HFPT module and should be exported as argument. To be able to do that the time0Format should be define in the general section of the general adapter run. This enables the use of the %TIME0% later in the general adapter run. Below an example of the general section is given. This will look the same for each moduleInstance.
<general>
<rootDir>%REGION_HOME%/Modules/HFPT</rootDir>
<workDir>%ROOT_DIR%/Config</workDir>
<exportDir>%ROOT_DIR%/work</exportDir>
<importDir>%ROOT_DIR%/work</importDir>
<dumpFileDir>$GA_DUMPFILEDIR$</dumpFileDir>
<dumpDir>%ROOT_DIR%</dumpDir>
<diagnosticFile>%ROOT_DIR%/work/Rdiagnostics.xml</diagnosticFile>
<time0Format>yyyy-MM-dd HH:mm:ss</time0Format>
</general>
4.3.2 Exporting activities
The input files are exported by the general adapter in PI-timeseries format and contains the forecast water level (or flow) for the location. The locationId of the forecasted time series is used to identify the error model directory.
The HFPT module is stateless. The relative viewperiod determines the length of the exported timeseries. This can be adjusted according to the specific requirements of the region. If necessary the start can also be controlled by a dummy exportStateActivity (not shown).
Below an example configuration of the exportTimeSeriesActivity. Note that this example if for Upper Severn Midlands where they use a hourly timestep.
<exportTimeSeriesActivity>
<exportFile>inputs.xml</exportFile>
<timeSeriesSets>
<timeSeriesSet>
<moduleInstanceId>Severn_Usev_FlowToLevel</moduleInstanceId>
<valueType>scalar</valueType>
<parameterId>H.rated.forecast</parameterId>
<locationId>2638</locationId>
<timeSeriesType>simulated forecasting</timeSeriesType>
<timeStep unit="hour" multiplier="1"/>
<relativeViewPeriod unit="hour" start="-24" end="48"/>
<readWriteMode>add originals</readWriteMode>
</timeSeriesSet>
</timeSeriesSets>
</exportTimeSeriesActivity>
4.3.3 Execute activities
After exporting the input file as inputs.xml, the general adapter carries out the execute activities as shown below.
<executeActivities>
<executeActivity>
<command>
<executable>$R_EXE$</executable>
</command>
<arguments>
<argument>--vanilla</argument>
<argument>%ROOT_DIR%/config/QR_FEWS.R</argument>
<argument>%ROOT_DIR%/work/inputs.xml</argument>
<argument>%ROOT_DIR%/work/output.xml</argument>
<argument>%TIME0%</argument>
</arguments>
<timeOut>60000</timeOut>
</executeActivity>
</executeActivities>
This executeActivity produces the error estimates conditional on the forecast water level time series contained in inputs.xml. These results are written in output.xml. The number of output timeseries depends on the number of quantiles specified in the csv files containing the error model.
Each timeseries gets a suffix in the parameterId based on the header of the error model file
<parameterId>H.simulated.forecast.Q5</parameterId>
<parameterId>H.simulated.forecast.Q25</parameterId>
Etc.
Several flags can be added to the timeseries in output.xml:
Flag="0" value is equal to original value (t < t0)
Flag="1" value is corrected and reliable
Flag="2" value is corrected, reliable but interpolated in between lead times
Flag="5" value is unreliable, extrapolated beyond the domain Quantile Regression relationships calibration
4.3.4 Importing activities
The time series in the output.xml are imported during the import activities.
<importActivities>
<importTimeSeriesActivity>
<importFile>output.xml</importFile>
<timeSeriesSets>
<timeSeriesSet>
<moduleInstanceId>QR_2638_H_Forecast</moduleInstanceId>
<valueType>scalar</valueType>
<parameterId>H.simulated.forecast</parameterId>
<locationId>2638</locationId>
<timeSeriesType>simulated forecasting</timeSeriesType>
<timeStep unit="hour" multiplier="1"/>
<readWriteMode>add originals</readWriteMode>
</timeSeriesSet>
<timeSeriesSet>
<moduleInstanceId>QR_2638_H_Forecast</moduleInstanceId>
<valueType>scalar</valueType>
<parameterId>H.simulated.forecast.05</parameterId>
<locationId>2638</locationId>
<timeSeriesType>simulated forecasting</timeSeriesType>
<timeStep unit="hour" multiplier="1"/>
<readWriteMode>add originals</readWriteMode>
</timeSeriesSet>
<timeSeriesSet>
<moduleInstanceId>QR_2638_H_Forecast</moduleInstanceId>
<valueType>scalar</valueType>
<parameterId>H.simulated.forecast.25</parameterId>
<locationId>2638</locationId>
<timeSeriesType>simulated forecasting</timeSeriesType>
<timeStep unit="hour" multiplier="1"/>
<readWriteMode>add originals</readWriteMode>
</timeSeriesSet>
Etc.
Etc.
</importTimeSeriesActivity>
</importActivities>
To be able to import the timeseries the parameters outputted by the HFPT module adapter must be specified in the \Config\RegionConfigFiles\Parameter.xml (containing the definitions of all parameters).
4.3.5 Log files
During the the HFPT Module run a log file is created in the work directory. Below an example of the log file and screenshot of display in NFFS.
<?xml version="1.0" encoding="UTF-8"?>
<Diag
xsi:schemaLocation="http://www.wldelft.nl/fews/PI http://fews.wldelft.nl/schemas/version1.0/pi-schemas/pi_diag.xsd"
version="1.2" xmlns="http://www.wldelft.nl/fews/PI" xmlns:xsi="http://www.w3.org/2001/XMLSchema-instance">
<line level="4" description="Running R in FEWS"/>
<line level="3" description="Running Quantile Regression via R in FEWS"/>
<line level="4" description="Starting R-script"/>
<line level="4" description="input file : F:\NFFS_UF\Midlands_SA\Modules\QR/work/inputs.xml"/>
<line level="4" description="output file : F:\NFFS_UF\Midlands_SA\Modules\QR/work/output.xml"/>
<line level="4" description="Reading data, locationId: 2074 startDate: 2008-01-04 00:00:00 endDate: 2008-01-07 00:00:00"/>
<line level="4" description="Simulated Q read from F:\NFFS_UF\Midlands_SA\Modules\QR\work\inputs.xml"/>
<line level="3" description="------------------------------------------------------------------------"/>
<line level="4" description="working with location: 2074 System date/time: Thu Apr 14 20:37:16 2011"/>
<line level="3" description="------------------------------------------------------------------------"/>
<line level="4" description="Loading QR models for location: 2074"/>
<line level="4" description="Loading QR models for location: 2074"/>
<line level="4" description="QR models found for location: 2074"/>
<line level="4" description="Generating corrected Q through QR"/>
<line level="3" description="Forecast quantiles generated"/>
<line level="4" description="Writing forecast quantiles to PI-timeseries: F:\NFFS_UF\Midlands_SA\Modules\QR\work\output.xml"/>
<line level="4" description="Forecast quantiles successfully written to PI-timeseries: F:\NFFS_UF\Midlands_SA\Modules\QR\work\output.xml"/>
<line level="3" description="Finished running QR post-processing via R in FEWS"/>
</Diag>
4.4 Display options
Once the forecast run is approved, the results can be displayed. This can be best taken care off in the Config\SystemConfigFiles\DisplayGroups.xml file. Of course it is also possible to make the individual timeseries visible via the Config\RegionConfigFiles\Filter.xml file.
Below an example of the configuration in the DisplayGroups. This will display the area between 5-95 (gray) and 25-75 (blue) in different colours. The colours available are listed
<display name="Llanidloes">
<description>2072</description>
<subplot>
<timeSeriesSet>
<moduleInstanceSetId>DODO_Historical</moduleInstanceSetId>
<valueType>scalar</valueType>
<parameterId>Q.simulated.historical</parameterId>
<locationId>2072</locationId>
<timeSeriesType>simulated historical</timeSeriesType>
<timeStep multiplier="60" unit="minute"/>
<relativeViewPeriod unit="hour" start="-24" end="0"/>
<readWriteMode>read only</readWriteMode>
</timeSeriesSet>
<timeSeriesSet>
<moduleInstanceSetId>DODO</moduleInstanceSetId>
<valueType>scalar</valueType>
<parameterId>Q.simulated.forecast</parameterId>
<locationId>2072</locationId>
<timeSeriesType>simulated forecasting</timeSeriesType>
<timeStep multiplier="60" unit="minute"/>
<relativeViewPeriod unit="hour" start="-12" end="50"/>
<readWriteMode>read only</readWriteMode>
</timeSeriesSet>
<timeSeriesSet>
<moduleInstanceSetId>DODO</moduleInstanceSetId>
<valueType>scalar</valueType>
<parameterId>Q.updated.forecast</parameterId>
<locationId>2072</locationId>
<timeSeriesType>simulated forecasting</timeSeriesType>
<timeStep multiplier="60" unit="minute"/>
<relativeViewPeriod unit="hour" start="-12" end="50"/>
<readWriteMode>read only</readWriteMode>
</timeSeriesSet>
<timeSeriesSet>
<moduleInstanceId>ImportTelemetry</moduleInstanceId>
<valueType>scalar</valueType>
<parameterId>Q.rated</parameterId>
<locationId>2072</locationId>
<timeSeriesType>external historical</timeSeriesType>
<timeStep multiplier="60" unit="minute"/>
<relativeViewPeriod unit="hour" start="-24" end="0"/>
<readWriteMode>read only</readWriteMode>
</timeSeriesSet>
</subplot>
<subplot>
<area>
<color>gray50</color>
<opaquenessPercentage>50</opaquenessPercentage>
<timeSeriesSet>
moduleInstanceId>QR_2072_H_Forecast</moduleInstanceId>
<valueType>scalar</valueType>
<parameterId>H.simulated.forecast.05</parameterId>
<locationId>2072</locationId>
<timeSeriesType>simulated forecasting</timeSeriesType>
<timeStep multiplier="60" unit="minute"/>
<relativeViewPeriod unit="hour" start="0" end="48"/>
<readWriteMode>read only</readWriteMode>
</timeSeriesSet>
<timeSeriesSet>
<moduleInstanceId>QR_2072_H_Forecast</moduleInstanceId>
<valueType>scalar</valueType>
<parameterId>H.simulated.forecast.95</parameterId>
<locationId>2072</locationId>
<timeSeriesType>simulated forecasting</timeSeriesType>
<timeStep multiplier="60" unit="minute"/>
<relativeViewPeriod unit="hour" start="0" end="48"/>
<readWriteMode>read only</readWriteMode>
</timeSeriesSet>
</area>
<area>
<color>blue</color>
<opaquenessPercentage>50</opaquenessPercentage>
<timeSeriesSet>
<moduleInstanceId>QR_2072_H_Forecast</moduleInstanceId>
<valueType>scalar</valueType>
<parameterId>H.simulated.forecast.25</parameterId>
<locationId>2072</locationId>
<timeSeriesType>simulated forecasting</timeSeriesType>
<timeStep multiplier="60" unit="minute"/>
<readWriteMode>read only</readWriteMode>
</timeSeriesSet>
<timeSeriesSet>
<moduleInstanceId>QR_2072_H_Forecast</moduleInstanceId>
<valueType>scalar</valueType>
<parameterId>H.simulated.forecast.75</parameterId>
<locationId>2072</locationId>
<timeSeriesType>simulated forecasting</timeSeriesType>
<timeStep multiplier="60" unit="minute"/>
<relativeViewPeriod unit="hour" start="0" end="48"/>
<readWriteMode>read only</readWriteMode>
</timeSeriesSet>
</area>
<timeSeriesSet>
<moduleInstanceId>QR_2072_H_Forecast</moduleInstanceId>
<valueType>scalar</valueType>
<parameterId>H.simulated.forecast</parameterId>
<locationId>2072</locationId>
<timeSeriesType>simulated forecasting</timeSeriesType>
<timeStep multiplier="60" unit="minute"/>
<relativeViewPeriod unit="hour" start="0" end="48"/>
<readWriteMode>read only</readWriteMode>
</timeSeriesSet>
<timeSeriesSet>
<moduleInstanceId>QR_2072_H_Forecast</moduleInstanceId>
<valueType>scalar</valueType>
<parameterId>H.simulated.forecast.50</parameterId>
<locationId>2072</locationId>
<timeSeriesType>simulated forecasting</timeSeriesType>
<timeStep multiplier="60" unit="minute"/>
<relativeViewPeriod unit="hour" start="0" end="48"/>
<readWriteMode>read only</readWriteMode>
</timeSeriesSet>
<timeSeriesSet>
<moduleInstanceSetId>DODO</moduleInstanceSetId>
<valueType>scalar</valueType>
<parameterId>H.rated.forecast</parameterId>
<locationId>2072</locationId>
<timeSeriesType>simulated forecasting</timeSeriesType>
<timeStep multiplier="60" unit="minute"/>
<relativeViewPeriod unit="hour" start="-12" end="50"/>
<readWriteMode>read only</readWriteMode>
</timeSeriesSet>
<timeSeriesSet>
<moduleInstanceId>ImportTelemetry</moduleInstanceId>
<valueType>scalar</valueType>
<parameterId>H.obs</parameterId>
<locationId>2072</locationId>
<timeSeriesType>external historical</timeSeriesType>
<timeStep multiplier="15" unit="minute"/>
<relativeViewPeriod unit="hour" start="-24" end="0"/>
<readWriteMode>read only</readWriteMode>
</timeSeriesSet>
</subplot>
</display>
5 References
Koenker, R.: Quantile Regression, Cambridge University Press., 2005.
Koenker, R.: Quantile regression in R: A vignette, [online] Available from: http://cran.r-project.org/web/packages/quantreg/vignettes/rq.pdf![]() , 2010.
, 2010.
Koenker, R. and Basset, G.: Regression Quantiles, Econometrica, 46(1), 33-50, 1978.
Koenker, R. and Hallock, K. F.: Quantile Regression, The Journal of Economic Perspectives, 15(4), 143-156, 2001.
Weerts, A.H., J. Schellekens, F. Sperna Weiland, 2010. Real-time geospatial data handling and forecasting: Examples from DELFT-FEWS forecasting platform/system, IEEE J. of Selected Topics in Appied Earth Observations and Remote Sensing, 3, 386-394, doi: 10.1109/JSTARS.2010.2046882.
Weerts, A.H., H.C. Winsemius, J.S. Verkade, 2011. Estimation of predictive hydrological uncertainty using quantile regression: Examples from the National Flood Forecasting System (England and Wales), Hydrol. Earth Syst. Sci., 15, 255--265, doi:10.5194/hess-15-255-2011. Available from: http://www.hydrol-earth-syst-sci.net/15/255/2011/hess-15-255-2011.html.
Werner, M.G.F., Van Dijk, M. and Schellekens, J., 2004, DELFT-FEWS: An open shell flood forecasting system, In 6th international conference on Hydroinformatics, Liong, Phoon and Babovic (Eds.), World Scientific Publishing Company, Singapore, 1205-1212.
A Calibration of Quantile Regression Relationships
In order to derive the error models, a long enough hindcast needs to be performed. For each lead time considered, an error model (i.e. relation between forecast value, forecast error and leadtime) can be derived from such a hindcast. Background information can be found in Weerts et al. (2011) also at http://www.hydrol-earth-syst-sci.net/15/255/2011/hess-15-255-2011.html or directly via http://www.hydrol-earth-syst-sci.net/15/255/2011/hess-15-255-2011.pdf.
A procedure has been written in R to support this. To use this procedure, first produce a long enough hindcast and make sure that observed values are written to a CSV file as follows:
19 Apr 2004 13:51,131.069 |
11 Aug 2004 23:21,309.644 |
24 Oct 2004 10:21,345.762 |
09 Jan 2005 07:36,347.430 |
17 Apr 2005 02:21,183.950 |
25 Oct 2005 20:06,246.336 |
09 Nov 2005 16:21,192.033 |
12 Jan 2006 01:06,146.348 |
16 Mar 2006 00:06,159.018 |
29 Mar 2006 08:21,277.829 |
. |
. |
. |
12 Jan 2007 06:15,404.215 |
22 Jan 2008 13:45,372.617 |
07 Sep 2008 13:30,398.788 |
30 Nov 2009 19:30,386.434 |
The forecast values should be written in exactly the same manner. The dates are not used in the current version. Simply make sure that both files contain the same number of lines and that the observed top value in time corresponds to the top value of the simulated values. If for instance QR error relationships are derived for a lead time of 6 hours, and the first entry in the observations represents the date and time 2010-01-01 12:00:00 then the first value in the paired simulation CSV file should contain the forecast value of the forecast with t0 = 2009-12-31 18:00:00 and lead time 6 hours. This setup is not very user friendly and we may change this in the future to use PI-timeseries with lead time information in the header instead.
Once these files are known, the user can run the batch file 'QR_derive.bat' with the following 6 inputs as arguments (make sure R is in your path, if not, the batch file will assume R is located in C:\program files\R\bin):
CSV - observed values
CSV - forecast values
Location name
Lead time
Quantiles
Missing value
A dataset for location VIKING1 has been delivered with the error derivation procedure. An example command line has been given below:
QR_derive "CSV/VIKING1_obs_01.csv" "CSV/VIKING1_mod_01.csv" "VIKING" "1" "0.05, 0.25, 0.5, 0.75, 0.95" "-990" |