Introduction
The FEWS Web Mapping Service with time support is the FEWS implementation of the WMS-T OGC standard and is available since 2017.02. It allows requesting images for plots that have been configured in the FEWS grid display. The WMS version that is supported is version 1.3. The EPSG:3857 projection (WGS84 Web Mercator) is supported. A nice tool to get the bounding box for this projection is bboxfinder.
Every gridPlot that has been configured in the grid display configuration represents a WMS layer.
WMS Request methods
The available request methods with their supported parameters are described here.
GetCapabilties
Get the available gridPlots and times available for each gridPlot at the current server system time. GetCapabilties will return its content as XML by default. JSON is supported as well, which is more convenient for web development.
Vendor Request parameters
- format (string, optional): Format of the response. Options are: application/xml or application/json. The default format is application/xml.
- layers (string, optional, since 2019.02): the layerId of the plot for which the capabilities should be determined. Only one layerId is currently supported.
- onlyHeaders (boolean, optional, since 2019.02): Get the capabilities without the times. The default is false.
- forecastPeriod: By default only the current forecast will be returned by the GetCapabilities. To get other forecasts, a forecast period needs to be specified. When any forecasts are found, they will be returned as a layer with the plotId and external forecast time combined. For example: france_gfs_T_forecasts-2019-06-24T00:00:00Z. When requesting the capabilities with a forecast period, it is required to specify a layerId with the layers parameter.
- startForecastTime (dateTime: yyyy-MM-ddTHH:mm:ssZ, since 2019.02): Start time of search period that looks for timeseries produced by forecasts that have their forecast time within this period.
- endForecastTime (dateTime: yyyy-MM-ddTHH:mm:ssZ, since 2019.02): End time of search period that looks for timeseries produced by forecasts that have their forecast time within this period.
- forecastCount (integer, since 2019.02): Number of forecast runs to return when using start- and end- forecast time. Default is 1.
- importFromExternalDataSource (boolean, optional, default=false, since 2020.01): apply seamless integration with the archive. Only valid when specifying a forecastPeriod (using startForecastTime, endForecastTime and forecastCount) and layers.
Response
When requesting the GetCapabilities without parameters an XMLresponse with be given with all available gridPlots nested by gridPlotGroupds.
Example request
http://localhost:8080/FewsWebServices/wms?request=GetCapabilities&format=application/xml
Example xml response
<WMS_Capabilities xmlns="http://www.opengis.net/wms" xmlns:xsi="http://www.w3.org/2001/XMLSchema-instance" xmlns:xlink="http://www.w3.org/1999/xlink" xsi:schemaLocation="http://www.opengis.net/wms http://schemas.opengis.net/wms/1.3.0/capabilities_1_3_0.xsd" version="1.3.0">
	<Service>
		<Name>WMS</Name>
		<Title>
Delft-FEWS Web Mapping Service with time support (WMS-T)
</Title>
	</Service>
	<Capability>
		<Request>
			<GetCapabilities>
				<Format>application/xml</Format>
				<Format>application/json</Format>
			</GetCapabilities>
			<GetMap>
				<Format>image/png</Format>
			</GetMap>
		</Request>
		<Exception>
			<Format>XML</Format>
		</Exception>
		<Layer>
			<Title>Delft-FEWS Web Mapping Service layers</Title>
			<CRS>EPSG:3857</CRS>
			<BoundingBox CRS="EPSG:3857" maxx="20037508.342789" maxy="20037508.342789" minx="-20037508.342789" miny="-20037508.342789"/>
			<Layer>
				<Name>Satellite precipitation</Name>
				<Title>Satellite precipitation</Title>
				<Layer queryable="1">
					<Name>Precipitation GPM [mm]</Name>
					<Title/>
					<Dimension units="ISO8601" name="time">
2018-10-05T12:30:00Z,2018-10-05T13:00:00Z,2018-10-05T13:30:00Z,2018-10-05T14:00:00Z,2018-10-05T14:30:00Z,2018-10-05T15:00:00Z,2018-10-05T15:30:00Z
</Dimension>
				</Layer>
			</Layer>
		</Layer>
	</Capability>
</WMS_Capabilities>
Example JSON response
{
  "title" : "Loire Spatial Data Display",
  "layers" : [ {
    "name" : "Precipitation GPM [mm]",
    "title" : "",
    "groupName" : "Satellite precipitation",
    "groupTitle" : "Satellite precipitation",
    "times" : [ "2018-10-05T12:30:00Z", "2018-10-05T13:00:00Z", "2018-10-05T13:30:00Z", "2018-10-05T14:00:00Z", "2018-10-05T14:30:00Z", "2018-10-05T15:00:00Z", "2018-10-05T15:30:00Z" ]
  }
}
Example request for getting capabilities of multiple forecasts (since 2019.02).
http://localhost:8080/FewsWebServices/wms?request=GetCapabilities&layers=france_gfs_T_forecasts&forecastCount=10&startForecastTime=2019-06-01T00:00:00Z&endForecastTime=2019-08-01T00:00:00Z
The response will give a unique layer name per externalForecast. For example: france_gfs_T_forecasts-2019-07-01T00:00:00Z. The externalForecastTime will be set in the title of the layer.
<?xml version="1.0" encoding="UTF-8"?>
<WMS_Capabilities xsi:schemaLocation="http://www.opengis.net/wms http://schemas.opengis.net/wms/1.3.0/capabilities_1_3_0.xsd" xmlns="http://www.opengis.net/wms" xmlns:xsi="http://www.w3.org/2001/XMLSchema-instance" xmlns:xlink="http://www.w3.org/1999/xlink" version="1.3.0">
    <Service>
        <Name>WMS</Name>
        <Title>Delft-FEWS Web Mapping Service with time support (WMS-T)</Title>
    </Service>
    <Capability>
        <Request>
            <GetCapabilities>
                <Format>application/xml</Format>
                <Format>application/json</Format>
            </GetCapabilities>
            <GetMap>
                <Format>image/png</Format>
            </GetMap>
        </Request>
        <Exception>
            <Format>XML</Format>
        </Exception>
        <Layer>
            <Title>Delft-FEWS Web Mapping Service layers</Title>
            <CRS>EPSG:3857</CRS>
            <BoundingBox CRS="EPSG:3857" maxx="20037508.342789" maxy="20037508.342789" minx="-20037508.342789" miny="-20037508.342789"></BoundingBox>
            <Layer>
                <Name>GFS Temperature Forecasts</Name>
                <Title></Title>
                <Layer queryable="1">
                    <Name>france_gfs_T_forecasts</Name>
                    <Title>GFS temperature forecasts France</Title>
                    <Layer queryable="1">
                        <Name>france_gfs_T_forecasts-2019-07-01T00:00:00Z</Name>
                        <Title>2019-07-01T00:00:00Z</Title>
                        <Dimension units="ISO8601" name="time">2019-07-01T00:00:00Z,2019-07-01T03:00:00Z,2019-07-01T06:00:00Z,2019-07-01T09:00:00Z,2019-07-01T12:00:00Z,2019-07-01T15:00:00Z,2019-07-01T18:00:00Z,2019-07-01T21:00:00Z,2019-07-02T00:00:00Z,2019-07-02T03:00:00Z,2019-07-02T06:00:00Z,2019-07-02T09:00:00Z,2019-07-02T12:00:00Z,2019-07-02T15:00:00Z,2019-07-02T18:00:00Z,2019-07-02T21:00:00Z,2019-07-03T00:00:00Z,2019-07-03T03:00:00Z,2019-07-03T06:00:00Z,2019-07-03T09:00:00Z,2019-07-03T12:00:00Z,2019-07-03T15:00:00Z,2019-07-03T18:00:00Z,2019-07-03T21:00:00Z,2019-07-04T00:00:00Z,2019-07-04T03:00:00Z,2019-07-04T06:00:00Z,2019-07-04T09:00:00Z,2019-07-04T12:00:00Z,2019-07-04T15:00:00Z,2019-07-04T18:00:00Z,2019-07-04T21:00:00Z,2019-07-05T00:00:00Z,2019-07-05T03:00:00Z,2019-07-05T06:00:00Z,2019-07-05T09:00:00Z,2019-07-05T12:00:00Z,2019-07-05T15:00:00Z,2019-07-05T18:00:00Z,2019-07-05T21:00:00Z,2019-07-06T00:00:00Z,2019-07-06T03:00:00Z,2019-07-06T06:00:00Z,2019-07-06T09:00:00Z,2019-07-06T12:00:00Z,2019-07-06T15:00:00Z,2019-07-06T18:00:00Z,2019-07-06T21:00:00Z,2019-07-07T00:00:00Z,2019-07-07T03:00:00Z,2019-07-07T06:00:00Z,2019-07-07T09:00:00Z,2019-07-07T12:00:00Z,2019-07-07T15:00:00Z,2019-07-07T18:00:00Z,2019-07-07T21:00:00Z,2019-07-08T00:00:00Z,2019-07-08T03:00:00Z,2019-07-08T06:00:00Z,2019-07-08T09:00:00Z,2019-07-08T12:00:00Z,2019-07-08T15:00:00Z,2019-07-08T18:00:00Z,2019-07-08T21:00:00Z,2019-07-09T00:00:00Z,2019-07-09T03:00:00Z,2019-07-09T06:00:00Z,2019-07-09T09:00:00Z,2019-07-09T12:00:00Z,2019-07-09T15:00:00Z,2019-07-09T18:00:00Z,2019-07-09T21:00:00Z,2019-07-10T00:00:00Z,2019-07-10T03:00:00Z,2019-07-10T06:00:00Z,2019-07-10T09:00:00Z,2019-07-10T12:00:00Z,2019-07-10T15:00:00Z,2019-07-10T18:00:00Z,2019-07-10T21:00:00Z,2019-07-11T00:00:00Z</Dimension>
                    </Layer>
                    <Layer queryable="1">
                        <Name>france_gfs_T_forecasts-2019-06-24T00:00:00Z</Name>
                        <Title>2019-06-24T00:00:00Z</Title>
                        <Dimension units="ISO8601" name="time">2019-06-24T00:00:00Z,2019-06-24T03:00:00Z,2019-06-24T06:00:00Z,2019-06-24T09:00:00Z,2019-06-24T12:00:00Z,2019-06-24T15:00:00Z,2019-06-24T18:00:00Z,2019-06-24T21:00:00Z,2019-06-25T00:00:00Z,2019-06-25T03:00:00Z,2019-06-25T06:00:00Z,2019-06-25T09:00:00Z,2019-06-25T12:00:00Z,2019-06-25T15:00:00Z,2019-06-25T18:00:00Z,2019-06-25T21:00:00Z,2019-06-26T00:00:00Z,2019-06-26T03:00:00Z,2019-06-26T06:00:00Z,2019-06-26T09:00:00Z,2019-06-26T12:00:00Z,2019-06-26T15:00:00Z,2019-06-26T18:00:00Z,2019-06-26T21:00:00Z,2019-06-27T00:00:00Z,2019-06-27T03:00:00Z,2019-06-27T06:00:00Z,2019-06-27T09:00:00Z,2019-06-27T12:00:00Z,2019-06-27T15:00:00Z,2019-06-27T18:00:00Z,2019-06-27T21:00:00Z,2019-06-28T00:00:00Z,2019-06-28T03:00:00Z,2019-06-28T06:00:00Z,2019-06-28T09:00:00Z,2019-06-28T12:00:00Z,2019-06-28T15:00:00Z,2019-06-28T18:00:00Z,2019-06-28T21:00:00Z,2019-06-29T00:00:00Z,2019-06-29T03:00:00Z,2019-06-29T06:00:00Z,2019-06-29T09:00:00Z,2019-06-29T12:00:00Z,2019-06-29T15:00:00Z,2019-06-29T18:00:00Z,2019-06-29T21:00:00Z,2019-06-30T00:00:00Z,2019-06-30T03:00:00Z,2019-06-30T06:00:00Z,2019-06-30T09:00:00Z,2019-06-30T12:00:00Z,2019-06-30T15:00:00Z,2019-06-30T18:00:00Z,2019-06-30T21:00:00Z,2019-07-01T00:00:00Z,2019-07-01T03:00:00Z,2019-07-01T06:00:00Z,2019-07-01T09:00:00Z,2019-07-01T12:00:00Z,2019-07-01T15:00:00Z,2019-07-01T18:00:00Z,2019-07-01T21:00:00Z,2019-07-02T00:00:00Z,2019-07-02T03:00:00Z,2019-07-02T06:00:00Z,2019-07-02T09:00:00Z,2019-07-02T12:00:00Z,2019-07-02T15:00:00Z,2019-07-02T18:00:00Z,2019-07-02T21:00:00Z,2019-07-03T00:00:00Z,2019-07-03T03:00:00Z,2019-07-03T06:00:00Z,2019-07-03T09:00:00Z,2019-07-03T12:00:00Z,2019-07-03T15:00:00Z,2019-07-03T18:00:00Z,2019-07-03T21:00:00Z,2019-07-04T00:00:00Z</Dimension>
                    </Layer>
                </Layer>
            </Layer>
        </Layer>
    </Capability>
</WMS_Capabilities>
Get Capabilites KeywordList (2020.01)
Since 2020.01 the Get Capabilities response will return a keywords list. This list contains the timeSeriesSet meta information of the configured layer. If a layer is configured with an ensemble, the ensembleId and the ensembleMemberId will be reported as well. See the following response where an ensemble with 3 members have been configured.
The keywordList can contain the meta data of one or more timeSeriesSet that are reported in sequence. The following fields are reported:
- parameterId
- locationId
- moduleInstanceId
- timeSeriesType
- ensembleId
- ensembleMemberId
<?xml version="1.0" encoding="UTF-8"?>
<WMS_Capabilities xsi:schemaLocation="http://www.opengis.net/wms http://schemas.opengis.net/wms/1.3.0/capabilities_1_3_0.xsd" xmlns="http://www.opengis.net/wms" xmlns:xsi="http://www.w3.org/2001/XMLSchema-instance" xmlns:xlink="http://www.w3.org/1999/xlink" version="1.3.0">
    <Service>
        <Name>WMS</Name>
        <Title>Delft-FEWS Web Mapping Service with time support (WMS-T)</Title>
    </Service>
    <Capability>
        <Request>
            <GetCapabilities>
                <Format>application/xml</Format>
                <Format>application/json</Format>
            </GetCapabilities>
            <GetMap>
                <Format>image/png</Format>
            </GetMap>
        </Request>
        <Exception>
            <Format>XML</Format>
        </Exception>
        <Layer>
            <Title>Delft-FEWS Web Mapping Service layers</Title>
            <CRS>EPSG:3857</CRS>
            <BoundingBox CRS="EPSG:3857" maxx="20037508.342789" maxy="20037508.342789" minx="-20037508.342789" miny="-20037508.342789"></BoundingBox>
            <Layer>
                <Name>Surge Ensemble</Name>
                <Title></Title>
                <Layer queryable="1">
                    <Name>CS3</Name>
                    <Title></Title>
                    <KeywordList>
                        <Keyword>parameterId=H.forecast.surge</Keyword>
                        <Keyword>locationId=EnsembleSurge</Keyword>
                        <Keyword>moduleInstanceId=ImportMOSurgeEnsemble</Keyword>
                        <Keyword>timeSeriesType=EXTERNAL_FORECASTING</Keyword>
                        <Keyword>ensembleId=MOSurge</Keyword>
                        <Keyword>ensembleMemberId=2</Keyword>
                        <Keyword>parameterId=H.forecast.surge</Keyword>
                        <Keyword>locationId=EnsembleSurge</Keyword>
                        <Keyword>moduleInstanceId=ImportMOSurgeEnsemble</Keyword>
                        <Keyword>timeSeriesType=EXTERNAL_FORECASTING</Keyword>
                        <Keyword>ensembleId=MOSurge</Keyword>
                        <Keyword>ensembleMemberId=1</Keyword>
                        <Keyword>parameterId=H.forecast.surge</Keyword>
                        <Keyword>locationId=EnsembleSurge</Keyword>
                        <Keyword>moduleInstanceId=ImportMOSurgeEnsemble</Keyword>
                        <Keyword>timeSeriesType=EXTERNAL_FORECASTING</Keyword>
                        <Keyword>ensembleId=MOSurge</Keyword>
                        <Keyword>ensembleMemberId=0</Keyword>
                    </KeywordList>
                    <Dimension name="ensemble_member" units="" multipleValues="1" nearestValue="0">MOSurge_2,MOSurge_1,MOSurge_0</Dimension>
                    <Dimension units="ISO8601" name="time">2020-04-13T07:00:00Z,2020-04-13T08:00:00Z,2020-04-13T09:00:00Z,2020-04-13T10:00:00Z,2020-04-13T11:00:00Z,2020-04-13T12:00:00Z,2020-04-13T13:00:00Z,2020-04-13T14:00:00Z,2020-04-13T15:00:00Z,2020-04-13T16:00:00Z,2020-04-13T17:00:00Z,2020-04-13T18:00:00Z,2020-04-13T19:00:00Z,2020-04-13T20:00:00Z,2020-04-13T21:00:00Z,2020-04-13T22:00:00Z,2020-04-13T23:00:00Z,2020-04-14T00:00:00Z,2020-04-14T01:00:00Z,2020-04-14T02:00:00Z,2020-04-14T03:00:00Z,2020-04-14T04:00:00Z,2020-04-14T05:00:00Z,2020-04-14T06:00:00Z,2020-04-14T07:00:00Z,2020-04-14T08:00:00Z,2020-04-14T09:00:00Z,2020-04-14T10:00:00Z,2020-04-14T11:00:00Z,2020-04-14T12:00:00Z,2020-04-14T13:00:00Z,2020-04-14T14:00:00Z,2020-04-14T15:00:00Z,2020-04-14T16:00:00Z,2020-04-14T17:00:00Z,2020-04-14T18:00:00Z,2020-04-14T19:00:00Z,2020-04-14T20:00:00Z,2020-04-14T21:00:00Z,2020-04-14T22:00:00Z,2020-04-14T23:00:00Z,2020-04-15T00:00:00Z,2020-04-15T01:00:00Z,2020-04-15T02:00:00Z,2020-04-15T03:00:00Z,2020-04-15T04:00:00Z,2020-04-15T05:00:00Z,2020-04-15T06:00:00Z,2020-04-15T07:00:00Z,2020-04-15T08:00:00Z,2020-04-15T09:00:00Z,2020-04-15T10:00:00Z,2020-04-15T11:00:00Z,2020-04-15T12:00:00Z,2020-04-15T13:00:00Z,2020-04-15T14:00:00Z,2020-04-15T15:00:00Z,2020-04-15T16:00:00Z,2020-04-15T17:00:00Z,2020-04-15T18:00:00Z,2020-04-15T19:00:00Z,2020-04-15T20:00:00Z,2020-04-15T21:00:00Z,2020-04-15T22:00:00Z,2020-04-15T23:00:00Z,2020-04-16T00:00:00Z,2020-04-16T01:00:00Z,2020-04-16T02:00:00Z,2020-04-16T03:00:00Z,2020-04-16T04:00:00Z,2020-04-16T05:00:00Z,2020-04-16T06:00:00Z,2020-04-16T07:00:00Z,2020-04-16T08:00:00Z,2020-04-16T09:00:00Z,2020-04-16T10:00:00Z,2020-04-16T11:00:00Z,2020-04-16T12:00:00Z,2020-04-16T13:00:00Z,2020-04-16T14:00:00Z,2020-04-16T15:00:00Z,2020-04-16T16:00:00Z,2020-04-16T17:00:00Z,2020-04-16T18:00:00Z,2020-04-16T19:00:00Z,2020-04-16T20:00:00Z,2020-04-16T21:00:00Z,2020-04-16T22:00:00Z,2020-04-16T23:00:00Z,2020-04-17T00:00:00Z,2020-04-17T01:00:00Z,2020-04-17T02:00:00Z,2020-04-17T03:00:00Z,2020-04-17T04:00:00Z,2020-04-17T05:00:00Z,2020-04-17T06:00:00Z,2020-04-17T07:00:00Z,2020-04-17T08:00:00Z,2020-04-17T09:00:00Z,2020-04-17T10:00:00Z,2020-04-17T11:00:00Z,2020-04-17T12:00:00Z,2020-04-17T13:00:00Z,2020-04-17T14:00:00Z,2020-04-17T15:00:00Z,2020-04-17T16:00:00Z,2020-04-17T17:00:00Z,2020-04-17T18:00:00Z,2020-04-17T19:00:00Z,2020-04-17T20:00:00Z,2020-04-17T21:00:00Z,2020-04-17T22:00:00Z,2020-04-17T23:00:00Z,2020-04-18T00:00:00Z,2020-04-18T01:00:00Z,2020-04-18T02:00:00Z,2020-04-18T03:00:00Z,2020-04-18T04:00:00Z,2020-04-18T05:00:00Z,2020-04-18T06:00:00Z,2020-04-18T07:00:00Z,2020-04-18T08:00:00Z,2020-04-18T09:00:00Z,2020-04-18T10:00:00Z,2020-04-18T11:00:00Z,2020-04-18T12:00:00Z,2020-04-18T13:00:00Z,2020-04-18T14:00:00Z,2020-04-18T15:00:00Z,2020-04-18T16:00:00Z,2020-04-18T17:00:00Z,2020-04-18T18:00:00Z,2020-04-18T19:00:00Z,2020-04-18T20:00:00Z,2020-04-18T21:00:00Z,2020-04-18T22:00:00Z,2020-04-18T23:00:00Z,2020-04-19T00:00:00Z,2020-04-19T01:00:00Z,2020-04-19T02:00:00Z,2020-04-19T03:00:00Z,2020-04-19T04:00:00Z,2020-04-19T05:00:00Z,2020-04-19T06:00:00Z,2020-04-19T07:00:00Z,2020-04-19T08:00:00Z,2020-04-19T09:00:00Z,2020-04-19T10:00:00Z,2020-04-19T11:00:00Z,2020-04-19T12:00:00Z,2020-04-19T13:00:00Z,2020-04-19T14:00:00Z,2020-04-19T15:00:00Z,2020-04-19T16:00:00Z,2020-04-19T17:00:00Z,2020-04-19T18:00:00Z,2020-04-19T19:00:00Z,2020-04-19T20:00:00Z,2020-04-19T21:00:00Z,2020-04-19T22:00:00Z,2020-04-19T23:00:00Z,2020-04-20T00:00:00Z</Dimension>
                </Layer>
            </Layer>
        </Layer>
    </Capability>
</WMS_Capabilities>
The JSON response is similar. The big difference is that the keywordList is reported as a list of objects. Each object represents a timeSeriesSet which makes it easier for web clients to process the meta-data.
{
  "title" : "Spatial Display",
  "layers" : [ {
    "name" : "CS3",
    "title" : "",
    "groupName" : "Surge Ensemble",
    "keywordList" : [ {
      "parameterId" : "H.forecast.surge",
      "locationId" : "EnsembleSurge",
      "moduleInstanceId" : "ImportMOSurgeEnsemble",
      "timeSeriesType" : "EXTERNAL_FORECASTING",
      "ensembleId" : "MOSurge",
      "ensembleMemberId" : "2"
    }, {
      "parameterId" : "H.forecast.surge",
      "locationId" : "EnsembleSurge",
      "moduleInstanceId" : "ImportMOSurgeEnsemble",
      "timeSeriesType" : "EXTERNAL_FORECASTING",
      "ensembleId" : "MOSurge",
      "ensembleMemberId" : "1"
    }, {
      "parameterId" : "H.forecast.surge",
      "locationId" : "EnsembleSurge",
      "moduleInstanceId" : "ImportMOSurgeEnsemble",
      "timeSeriesType" : "EXTERNAL_FORECASTING",
      "ensembleId" : "MOSurge",
      "ensembleMemberId" : "0"
    } ],
    "ensembles" : [ {
      "ensembleId" : "MOSurge",
      "ensembleMemberIds" : [ "2", "1", "0" ]
    } ],
    "times" : [ "2020-04-13T07:00:00Z", "2020-04-13T08:00:00Z", "2020-04-13T09:00:00Z", "2020-04-13T10:00:00Z", "2020-04-13T11:00:00Z", "2020-04-13T12:00:00Z", "2020-04-13T13:00:00Z", "2020-04-13T14:00:00Z", "2020-04-13T15:00:00Z", "2020-04-13T16:00:00Z", "2020-04-13T17:00:00Z", "2020-04-13T18:00:00Z", "2020-04-13T19:00:00Z", "2020-04-13T20:00:00Z", "2020-04-13T21:00:00Z", "2020-04-13T22:00:00Z", "2020-04-13T23:00:00Z", "2020-04-14T00:00:00Z", "2020-04-14T01:00:00Z", "2020-04-14T02:00:00Z", "2020-04-14T03:00:00Z", "2020-04-14T04:00:00Z", "2020-04-14T05:00:00Z", "2020-04-14T06:00:00Z", "2020-04-14T07:00:00Z", "2020-04-14T08:00:00Z", "2020-04-14T09:00:00Z", "2020-04-14T10:00:00Z", "2020-04-14T11:00:00Z", "2020-04-14T12:00:00Z", "2020-04-14T13:00:00Z", "2020-04-14T14:00:00Z", "2020-04-14T15:00:00Z", "2020-04-14T16:00:00Z", "2020-04-14T17:00:00Z", "2020-04-14T18:00:00Z", "2020-04-14T19:00:00Z", "2020-04-14T20:00:00Z", "2020-04-14T21:00:00Z", "2020-04-14T22:00:00Z", "2020-04-14T23:00:00Z", "2020-04-15T00:00:00Z", "2020-04-15T01:00:00Z", "2020-04-15T02:00:00Z", "2020-04-15T03:00:00Z", "2020-04-15T04:00:00Z", "2020-04-15T05:00:00Z", "2020-04-15T06:00:00Z", "2020-04-15T07:00:00Z", "2020-04-15T08:00:00Z", "2020-04-15T09:00:00Z", "2020-04-15T10:00:00Z", "2020-04-15T11:00:00Z", "2020-04-15T12:00:00Z", "2020-04-15T13:00:00Z", "2020-04-15T14:00:00Z", "2020-04-15T15:00:00Z", "2020-04-15T16:00:00Z", "2020-04-15T17:00:00Z", "2020-04-15T18:00:00Z", "2020-04-15T19:00:00Z", "2020-04-15T20:00:00Z", "2020-04-15T21:00:00Z", "2020-04-15T22:00:00Z", "2020-04-15T23:00:00Z", "2020-04-16T00:00:00Z", "2020-04-16T01:00:00Z", "2020-04-16T02:00:00Z", "2020-04-16T03:00:00Z", "2020-04-16T04:00:00Z", "2020-04-16T05:00:00Z", "2020-04-16T06:00:00Z", "2020-04-16T07:00:00Z", "2020-04-16T08:00:00Z", "2020-04-16T09:00:00Z", "2020-04-16T10:00:00Z", "2020-04-16T11:00:00Z", "2020-04-16T12:00:00Z", "2020-04-16T13:00:00Z", "2020-04-16T14:00:00Z", "2020-04-16T15:00:00Z", "2020-04-16T16:00:00Z", "2020-04-16T17:00:00Z", "2020-04-16T18:00:00Z", "2020-04-16T19:00:00Z", "2020-04-16T20:00:00Z", "2020-04-16T21:00:00Z", "2020-04-16T22:00:00Z", "2020-04-16T23:00:00Z", "2020-04-17T00:00:00Z", "2020-04-17T01:00:00Z", "2020-04-17T02:00:00Z", "2020-04-17T03:00:00Z", "2020-04-17T04:00:00Z", "2020-04-17T05:00:00Z", "2020-04-17T06:00:00Z", "2020-04-17T07:00:00Z", "2020-04-17T08:00:00Z", "2020-04-17T09:00:00Z", "2020-04-17T10:00:00Z", "2020-04-17T11:00:00Z", "2020-04-17T12:00:00Z", "2020-04-17T13:00:00Z", "2020-04-17T14:00:00Z", "2020-04-17T15:00:00Z", "2020-04-17T16:00:00Z", "2020-04-17T17:00:00Z", "2020-04-17T18:00:00Z", "2020-04-17T19:00:00Z", "2020-04-17T20:00:00Z", "2020-04-17T21:00:00Z", "2020-04-17T22:00:00Z", "2020-04-17T23:00:00Z", "2020-04-18T00:00:00Z", "2020-04-18T01:00:00Z", "2020-04-18T02:00:00Z", "2020-04-18T03:00:00Z", "2020-04-18T04:00:00Z", "2020-04-18T05:00:00Z", "2020-04-18T06:00:00Z", "2020-04-18T07:00:00Z", "2020-04-18T08:00:00Z", "2020-04-18T09:00:00Z", "2020-04-18T10:00:00Z", "2020-04-18T11:00:00Z", "2020-04-18T12:00:00Z", "2020-04-18T13:00:00Z", "2020-04-18T14:00:00Z", "2020-04-18T15:00:00Z", "2020-04-18T16:00:00Z", "2020-04-18T17:00:00Z", "2020-04-18T18:00:00Z", "2020-04-18T19:00:00Z", "2020-04-18T20:00:00Z", "2020-04-18T21:00:00Z", "2020-04-18T22:00:00Z", "2020-04-18T23:00:00Z", "2020-04-19T00:00:00Z", "2020-04-19T01:00:00Z", "2020-04-19T02:00:00Z", "2020-04-19T03:00:00Z", "2020-04-19T04:00:00Z", "2020-04-19T05:00:00Z", "2020-04-19T06:00:00Z", "2020-04-19T07:00:00Z", "2020-04-19T08:00:00Z", "2020-04-19T09:00:00Z", "2020-04-19T10:00:00Z", "2020-04-19T11:00:00Z", "2020-04-19T12:00:00Z", "2020-04-19T13:00:00Z", "2020-04-19T14:00:00Z", "2020-04-19T15:00:00Z", "2020-04-19T16:00:00Z", "2020-04-19T17:00:00Z", "2020-04-19T18:00:00Z", "2020-04-19T19:00:00Z", "2020-04-19T20:00:00Z", "2020-04-19T21:00:00Z", "2020-04-19T22:00:00Z", "2020-04-19T23:00:00Z", "2020-04-20T00:00:00Z" ]
  } ]
}
Get Capabilites Styles (2020.02)
In the timeSeriesDisplay.xml configuration, one or more classBreaks can be configured. For example:
<classBreaks id="Class.Temperature.Extreme">
   <description>Extreme Temperature Style</description>
   <missingValueColor>white</missingValueColor>
   <missingValueOpaquenessPercentage>0</missingValueOpaquenessPercentage>
   <belowRangeColor>black</belowRangeColor>
   <belowRangeOpaquenessPercentage>0</belowRangeOpaquenessPercentage>
   <aboveRangeColor>black</aboveRangeColor>
   <aboveRangeOpaquenessPercentage>0</aboveRangeOpaquenessPercentage>
   <unitVisible>true</unitVisible>
   <color color="042333" symbolSize="10" lowerValue="0"/>
   <color color="3C0912" symbolSize="10" lowerValue="10"/>
   <color color="730E27" symbolSize="10" lowerValue="20"/>
   <color color="A62225" symbolSize="10" lowerValue="30"/>
   <color color="C0583B" symbolSize="10" lowerValue="40"/>
   <color color="D08B73" symbolSize="10" lowerValue="50"/>
   <color color="DFBCB0" symbolSize="10" lowerValue="60"/>
   <color color="F1EDEC" symbolSize="10" lowerValue="70"/>
</classBreaks>
In the gridDisplay.xml for each gridPlot one or more classBreakId's can be referenced. For example:
<gridPlot id="kzn_temperature" name="Temperature">
   <dataLayer>
      <timeSeriesSet>
         <moduleInstanceId>kzn</moduleInstanceId>
         <valueType>grid</valueType>
         <parameterId>water_temperature</parameterId>
         <locationId>SigmaLayer_0</locationId>
         <timeSeriesType>external historical</timeSeriesType>
         <timeStep unit="nonequidistant"/>
         <readWriteMode>read complete forecast</readWriteMode>
      </timeSeriesSet>
      <sigmaScaleReferenceTimeSeriesSet>
         <moduleInstanceId>kzn</moduleInstanceId>
         <valueType>grid</valueType>
         <parameterId>water_depth</parameterId>
         <locationId>kzn</locationId>
         <timeSeriesType>external historical</timeSeriesType>
         <timeStep unit="nonequidistant"/>
         <readWriteMode>read complete forecast</readWriteMode>
      </sigmaScaleReferenceTimeSeriesSet>
   </dataLayer>
   <hideLastValueCheckBox>true</hideLastValueCheckBox>
   <classBreaksId>Class.Temperature</classBreaksId>
   <classBreaksId>Class.Temperature.Extreme</classBreaksId>
</gridPlot>
All classbreaks that have be configured this way, using classBreaksId references, will be reported in the GetCapabilties of the layer as a possible style that can be applied to the GetMap or GetLegendGraphic request. See for example the following GetCapabilities response where the kzn_temperature layer supports 2 styles: Class.Temperature and Class.Temperature.Extreme.
<Layer queryable="1">
    <Name>kzn_temperature</Name>
    <Title>Temperature</Title>
    <KeywordList>
        <Keyword>parameterId=water_temperature</Keyword>
        <Keyword>locationId=SigmaLayer_0</Keyword>
        <Keyword>moduleInstanceId=kzn</Keyword>
        <Keyword>timeSeriesType=EXTERNAL_HISTORICAL</Keyword>
    </KeywordList>
    <Dimension units="ISO8601" name="time">2010-04-15T00:00:00Z,2010-04-15T01:00:00Z,2010-04-15T02:00:00Z,2010-04-15T03:00:00Z,2010-04-15T04:00:00Z,2010-04-15T05:00:00Z,2010-04-15T06:00:00Z,2010-04-15T07:00:00Z,2010-04-15T08:00:00Z,2010-04-15T09:00:00Z,2010-04-15T10:00:00Z,2010-04-15T11:00:00Z,2010-04-15T12:00:00Z,2010-04-15T13:00:00Z,2010-04-15T14:00:00Z,2010-04-15T15:00:00Z,2010-04-15T16:00:00Z,2010-04-15T17:00:00Z,2010-04-15T18:00:00Z,2010-04-15T19:00:00Z,2010-04-15T20:00:00Z,2010-04-15T21:00:00Z,2010-04-15T22:00:00Z,2010-04-15T23:00:00Z,2010-04-16T00:00:00Z</Dimension>
    <Dimension units="water_depth" name="elevation">10.453057/3432.3235</Dimension>
    <Style>
        <Name>Class.Temperature</Name>
        <Title>Temperature Style</Title>
    </Style>
    <Style>
        <Name>Class.Temperature.Extreme</Name>
        <Title>Extreme Temperature Style</Title>
    </Style>
</Layer>
GetMap
Get the plot image as png for a layer for a requested time, image size and extent. Only untiled images are supported, which means the complete image has to be requested for the complete extent.
Request parameters
- layers (required): the layerId of the plot to display. Only one layerid is supported.
- time (required): the time for which the grid has to be plotted. Only one time is supported. Time ranges are NOT supported. Time has to be in the xml dateformat: yyyy-MM-ddTHH:mm:ssZ. The times returned by the GetCapabilities are in this format as well.
- width (optional): width of the image. Default is 800.
- height (optional): height of the image. Default is 600
- version (optional): supported version is 1.3 and is the default if not set. Older versions might work, but are not supported
- crs (required): the output projection of the plot. Only supported projection is: EPSG:3857
- bbox (required): the bounding box (in the projection as defined by the SRS parameter) of the extent that should be plot.
- colorscalerange (optional, since 2020.02): rescale the colors in the map by changing the min and max values of the range. The minimuma value and maximum value are seperated by a , For example: colorscalerange=2.0,10.0. This option can be used for legends as well.
- styles (optional, since 2020.02 ): a style can be passed as request parameter by passing the styles parameter. N.B. only one style can currently be passed to the GetMap request. For example: styles=Class.Temperature.Extreme. Available styles are reported by GetCapabilities per layer.
Vendor request parameters
- showContours (optional, since 2018.02): Display contour lines if enabled in the gridplot. Default is false. Set to true to show contour lines.
- externalForecastTime (dateTime: yyyy-MM-ddTHH:mm:ssZ, since 2019.02): get the map for a specific forecast time.
- importFromExternalDataSource (boolean, optional, default=false, since 2020.01): apply seamless integration with the archive. Only valid for external forecasts. Both an externalForecast time and layers have to be specified as well.
- ensembleId (optional). Since 2020.01. Specify the ensemble id of the requested grid. When using this parameter, specifying the ensembleMemberId is required as well. The available ensembleId is reported by the GetCapabilities request.
- ensembleMemberId (optional). Since 2020.01. Specify the ensemble member id of the requested grid. When using this parameter, specifying the ensembleId is required as well. The available ensembleMemberIds are reported by the GetCapabilities request.
- dim_ensemble_member (otpional). Since 2020.01. This parameter can be used instead of the ensembleId and ensembleMemberId parameters and follow the recommendations in: https://docs.opengeospatial.org/bp/16-086r3/16-086r3.html#23. This parameter can be used to pass both the ensembleId and ensembleMemberId separated by a underscore. For example: dim_ensemble_member=MOSurge_1
Restrictions:
- The product of width and height is limited to the full HD resolution of 1920x1200 to avoid memory issues. In case a GetMap request is done where WIDTH*HEIGHT > 2304000 a bad request error will be returned. Since 2020.01 the default max width*height has been increased to 10000000.
Response
Transparent PNG image of the requested gridPlot for the specified timeStep, size and extent.
Example request
http://localhost:8080/FewsWebServices/wms?service=WMS&request=GetMap&version=1.3&layers=Temp_forecast_nwp&crs=EPSG%3A3857&time=2018-09-01T00%3A00%3A00.000Z&width=920&height=500&bbox=-1261269.140637805,4786137.922323937,1921144.283455659,6515710.435418212
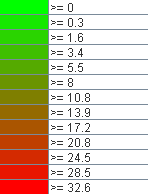
Example png response:

Example request for a specific forecast using externalForecastTime and layers
http://localhost:8080/FewsWebServices/wms?request=GetMap&version=1.3&externalForecastTime=2019-07-01T00:00:00Z&layers=france_gfs_T_forecasts&crs=EPSG%3A3857&time=2019-07-01T12:00:00Z&width=920&height=500&bbox=-1416930.666816287,5052492.089340451,1765482.757277179,6782064.602434729
Example request for a specific forecast using a layer name with external forecast time embedded in the layer name
http://localhost:8080/FewsWebServices/wms?request=GetMap&version=1.3&layers=france_gfs_T_forecasts-2019-06-24T00:00:00Z&crs=EPSG%3A3857&time=2019-07-01T12:00:00Z&width=920&height=500&bbox=-1416930.666816287,5052492.089340451,1765482.757277179,6782064.602434729
Example request for a specific forecast and ensemble member
http://localhost:8080/FewsWebServices/wms?service=WMS&request=GetMap&version=1.3&layers=CS3-ens-2020-04-12T18%3A00%3A00Z&styles=&format=image%2Fpng&transparent=true&crs=EPSG%3A3857&showContours=false&importFromExternalDataSource=false&ensembleId=MOSurge&ensembleMemberId=2&time=2020-04-16T23%3A00%3A00.000Z&uppercase=false&width=920&height=600&bbox=-1787059.1846184619,6194009.947982673,1395354.2394750044,8269496.963695805
Example request for a specific forecast and ensemble member using the dim_ensemble_member parameter
http://localhost:8080/FewsWebServices/wms?service=WMS&request=GetMap&version=1.3&layers=CS3-ens-2020-04-12T18%3A00%3A00Z&styles=&format=image%2Fpng&transparent=true&crs=EPSG%3A3857&showContours=false&importFromExternalDataSource=false&dim_ensemble_member=MOSurge_2&time=2020-04-16T23%3A00%3A00.000Z&uppercase=false&width=920&height=600&bbox=-1787059.1846184619,6194009.947982673,1395354.2394750044,8269496.963695805
Example request using a style
http://localhost:8080/FewsWebServices/wms?service=WMS&request=GetMap&version=1.3&layers=kzn_z_salinity&format=image%2Fpng&transparent=true&crs=EPSG%3A3857&showContours=false&styles=Class.Salinity&time=2010-04-15T19%3A00%3A00.000Z&uppercase=false&width=920&height=600&bbox=3142222.4777002227,-3789947.3838540292,3937825.8337235893,-3271075.6299257413
Example request using a colorscalerange
http://localhost:8080/FewsWebServices/wms?service=WMS&request=GetMap&version=1.3&layers=kzn_z_salinity&format=image%2Fpng&transparent=true&crs=EPSG%3A3857&showContours=false&colorscalerange=2.0,10.0&time=2010-04-15T19%3A00%3A00.000Z&uppercase=false&width=920&height=600&bbox=3142222.4777002227,-3789947.3838540292,3937825.8337235893,-3271075.6299257413
GetLegendGraphic
Get the legend as an image in png or in json format for a specified gridPlotId.
Request parameters
- layers (required): the gridPlotId of the gridPlot which legend should be displayed. Only one gridPlotId is supported.
- width (optional): width of the legend. Default is 150.
- height (optional): height of the image. The default is based on the number of legend items, 15 pixels per item.
- colorscalerange (optional, since 2020.02): rescale the colors in the map by changing the min and max values of the range. The minimuma value and maximum value are seperated by a , For example: colorscalerange=2.0,10.0. This parametercan be used for the GetMap as well.
- style (optional, since 2020.02 ): a style can be passed as request parameter. For example: style=Class.Temperature.Extreme. Available styles are reported by the GetCapabilities request per layer.
Vendor request parameters
- format (optional, since 2020.02): The format of the GetLegendGraphic response. Possible values are: image/png (the default) or application/json.
Response in PNG
Transparent PNG image of the requested legend graphics for the specified gridPlotId and size.
Example request:
http://localhost:8181/FewsWebServices/wms?SERVICE=WMS&REQUEST=GetLegendGraphic&LAYERS=Precipitation%20GPM%20%5Bmm%5D&WIDTH=150&HEIGHT=400
Example png response
Response in JSON with style
The following example requests a legend in json format and applies a style as well.
http://localhost:8181/FewsWebServices/wms?SERVICE=WMS&request=GetLegendGraphic&layers=kzn_temperature&format=application/json&style=Class.Temperature.Extreme
The json response is as follows:
{
  "legend" : [ {
    "lowerValue" : 0.0,
    "color" : "#042333"
  }, {
    "lowerValue" : 10.0,
    "color" : "#3c0912"
  }, {
    "lowerValue" : 20.0,
    "color" : "#730e27"
  }, {
    "lowerValue" : 30.0,
    "color" : "#a62225"
  }, {
    "lowerValue" : 40.0,
    "color" : "#c0583b"
  }, {
    "lowerValue" : 50.0,
    "color" : "#d08b73"
  }, {
    "lowerValue" : 60.0,
    "color" : "#dfbcb0"
  }, {
    "lowerValue" : 70.0,
    "color" : "#f1edec"
  } ]
}
Response in JSON with style and colorscalerange
The following example requests a legend in json format and applies a style and applies a colorscale range as well.
http://localhost:8181/FewsWebServices/wms?SERVICE=WMS&request=GetLegendGraphic&layers=kzn_temperature&format=application/json&style=Class.Temperature.Extreme&colorscalerange=30.0,50.0
The json response is as follows:
{
  "legend" : [ {
    "lowerValue" : 30.0,
    "color" : "#042333"
  }, {
    "lowerValue" : 32.9,
    "color" : "#3c0912"
  }, {
    "lowerValue" : 35.7,
    "color" : "#730e27"
  }, {
    "lowerValue" : 38.6,
    "color" : "#a62225"
  }, {
    "lowerValue" : 41.4,
    "color" : "#c0583b"
  }, {
    "lowerValue" : 44.3,
    "color" : "#d08b73"
  }, {
    "lowerValue" : 47.1,
    "color" : "#dfbcb0"
  }, {
    "lowerValue" : 50.0,
    "color" : "#f1edec"
  } ]
}
WMS Test Page
Most functionality of the WMS service can be tested using the WMS service test page.
General usage
On the top left there are buttons to zoom in, zoom out and enter full screen mode.
On the bottom is the time navigator that will be populated with all available times for the currently selected layer. Using the time navigator you can step back and foreward in time, start or stop animations, enable autorepeat and select the number of frames per second (fps) that should be used during animation.
Layer and forecast selection
All available layers reported by the GetCapabilities will be available in a dropdown list. For some layers it is also possible to search for older forecasts. They are not reported by default by the GetCapabilites but requires an explicit search. This can be done by specifiying a forecast period and selecting how many forecast should be searched for during that period. When clicking the play button next to the forecast period, all available forecast times will be available in the drop down list next to the selected layer. To display a specific forecast, the forecast time can be selected from the drop down list.

Archive integration
In case an archive is connected to the FewsWebServices, it is also possible to retrieve data from the archive. Enable the Archive integration checkbox to try to get grid data from the archive if not found in the Delft-FEWS database.
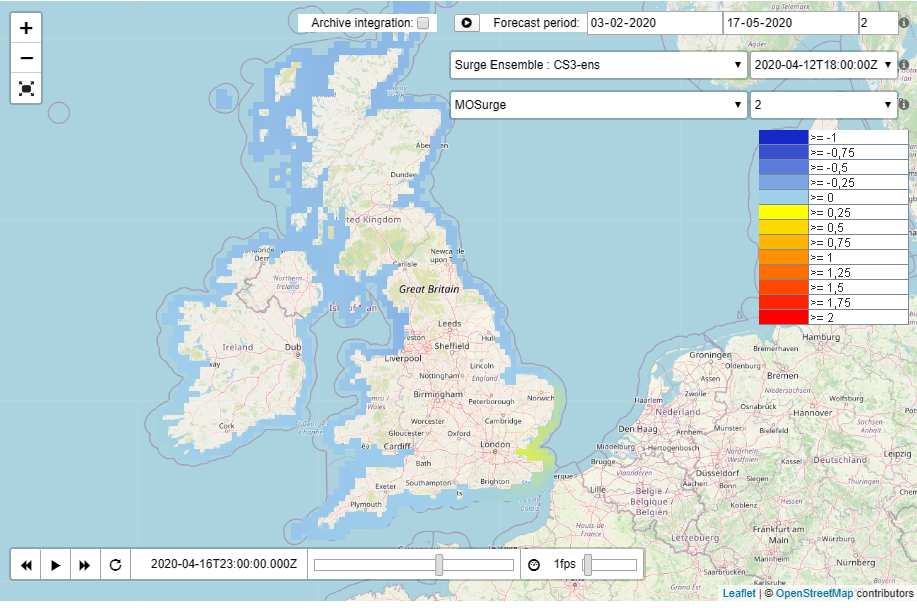
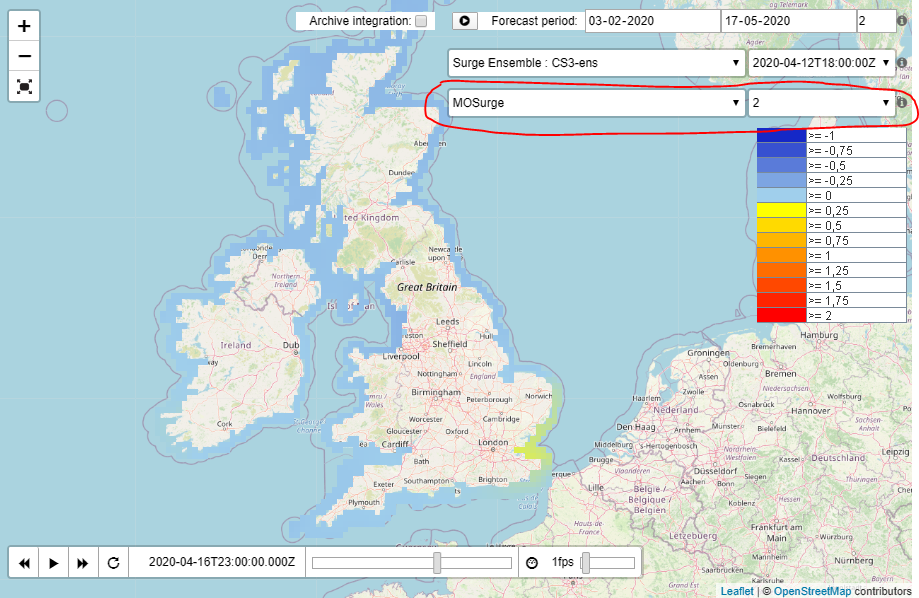
Ensembles
Using the WMS Test page an extra dropdown list will appear below the Selected layer. In this example layer CS3-ens is an ensemble grid. The ensembleId is "MOSurge". When selected, the list of ensemble member id's will be populated next to it which allows you to select a specific ensemble member on the test page. When right clicking on a specific grid cell, the timeseries can be requested for a specific grid cell for the selected layer, external forecast time, ensemble and time step.
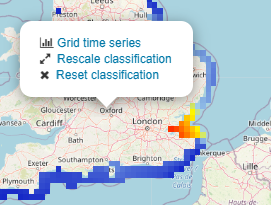
Timeseries of grid cell
When right clicking on a grid cell a popup will appear that will allow you to select the grid time series. When selecting the link the testpage will get the value of the currently selected time, but it is also possible to request a longer period.

In the popup the selected parameter and the value is displayed and a link is available that was used to get the value of the grid cell.
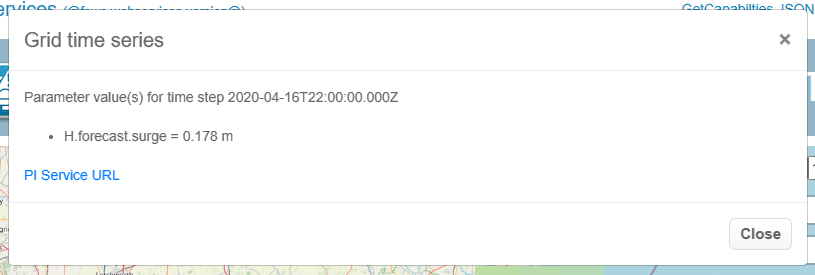
In this case the used URL was as follows:
http://localhost:8080/FewsWebServices/rest/fewspiservice/v1/timeseries/grid?documentFormat=PI_JSON&layers=CS3_ens&x=70069.30131651618&y=6712449.30878268&startTime=2020-04-16T22:00:00.000Z&endTime=2020-04-16T22:00:00.000Z&bbox=-97699.23245362783,6592244.019122629,300102.44555805344,6851679.896086771&_=1596030818327&importFromExternalDataSource=false
Rescale colors
When right clicking on the map, the popup will aso allow you to rescale the current map and legend. In this example the classification will be rescaled by setting the lower value to 0 and the upper value to 0.2
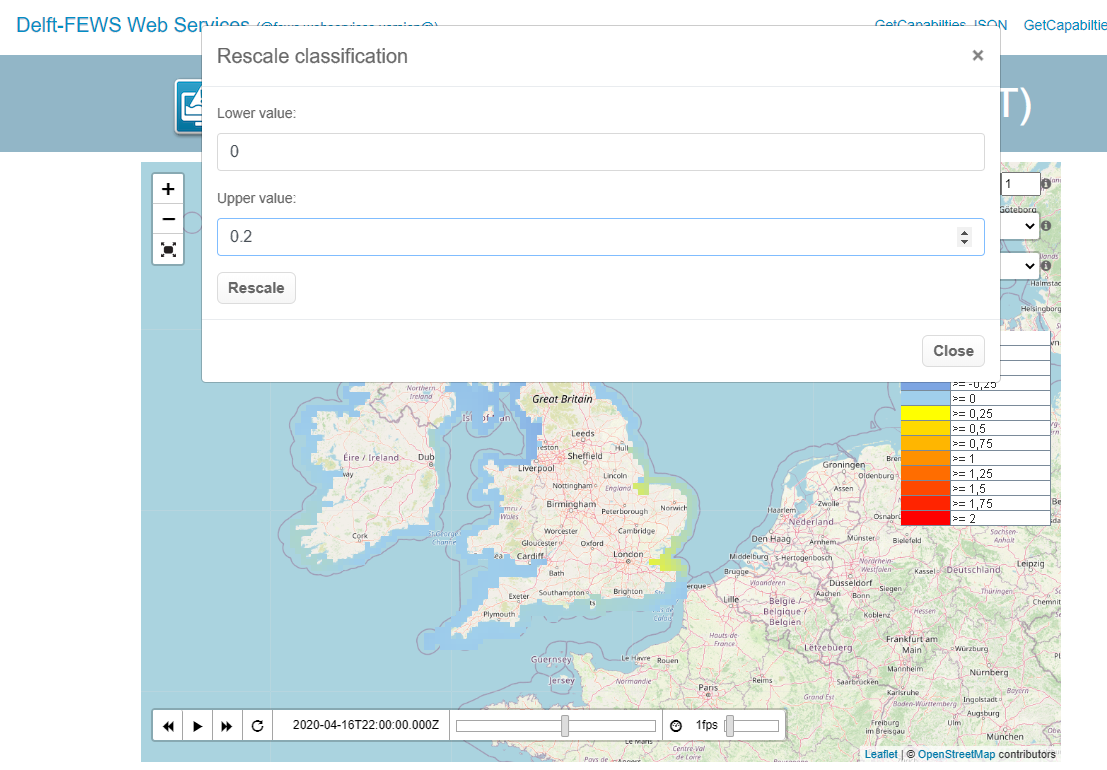
After rescaling both the map and the legend are updated with the current classification.

It is also possible to reset the original classification by using the right mouse click again. The reset classifcation option is now available.
Styles
If the GetCapabilities of a layer reports on any styles, an drop down list will become visible with the possible styles. In the following example the style Class.waterlevel can be selected.

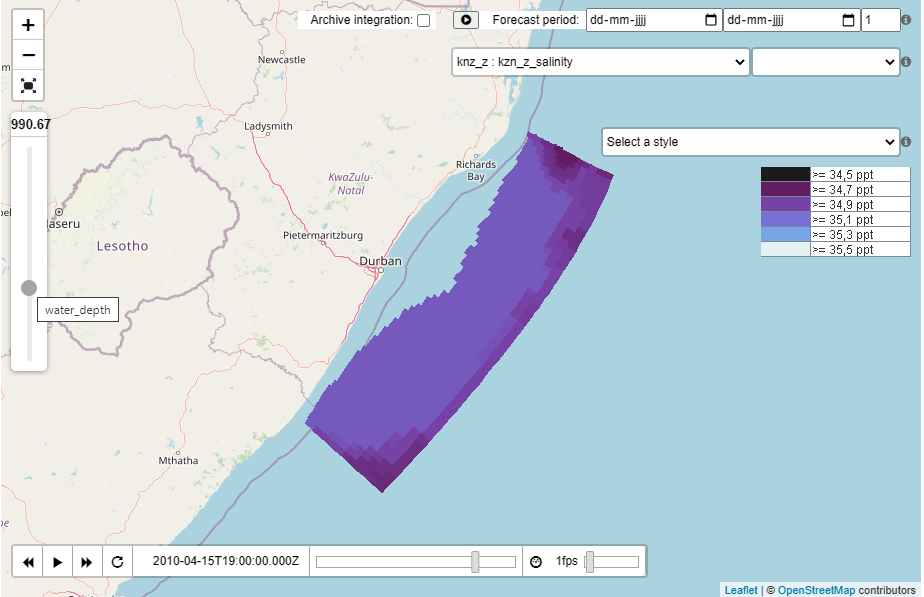
Elevation
In case the GetCapabilities reports elevation as a dimension of the layer, a vertical slider will be displayed that will allow you to select the elevation. The slider will display the currently selected elevation value. On the button the name of the elevation is displayed, in this case: water_depth. The test page will use the reported elevation range to set the minimum and maximum values of the slider.
Properties
The following WMS specific properties can be configured in the FewsPiService.properties file. For more information on properties, see: FEWS Web Services configuration FewsPiService.properties
WMS_BASE_URL (string): url that will be reported in the GetCapabilities response as URL to be used to request maps.
WMS_CLIENT_CACHE_TIMEOUT (integer): Timeout of the cache in seconds, that is sent to the browser. default is 300 seconds (15 minutes). To disable caching, set the timeout to 0.
- WMS_ALLOWED_GRID_PLOT_GROUP_ID (string): Id of the grid plot group which layers will be made available in the WMS service. If not configured, all layers are available.
- WMS_IMAGE_MAX_WIDTH_HEIGHT (integer): The maximum size of the WIDTH and HEIGHT product GetMap parameters. For 2020.01 the default is set to 10 million (The default before 2020.01 was set to 2304000, the full HD resolution of 1920x1200). N.B.: The higher this value is set, the more memory is required to generated the WMS images.
- WMS_MAX_NUMBER_OF_CACHED_LAYERS (integer, since 2019.02, obsolete since 2020.01 since layers are no longer cached): The maximum number of layers that are cached in the WMS services. The default is 100. The optimal number depends on the amount of memory available and the number of configured layers and the size of the layers. When the WMS runs into Out Of Memory issues, the size of the number should be lowered or the memory increased.
ICT requirements
For general FewsWebServices requirements, see: Installation
Specific requirements for the FEWS WMS service very much depend on the number of layers that are used and the size of the layer grids. To avoid memory issues the number of layers should be restricted by specifying the WMS_ALLOWED_GRID_PLOT_GROUP_ID property.
The tomcat server the WMS service is running on should have sufficient memory. When many concurrent users are using the WMS service the CPU requirements will increase as well since all images have to be rendered at the same time on the same server. It is recommended to start at least with 2GByte of memory with the -Xmx2G JVM parameter.
Since the WMS service is stateless, it can be scaled both vertically (more cpu and memory) and horizontally (more tomcat instances).
Tomcat itself can also be tuned by specifying the number of concurrent requests. In case memory errors occur or the CPU load gets too high, the tomcat server.xml can be tuned to limit the number of concurrent requests. In the tomcat server.xml the maxThreads parameter specifies the maximum number of concurrent requests that are allowed. For Tomcat 7 this is set to 200 by default, which is quite a lot for a WMS service. See the following example where the tomcat server.xml has been configured with a maximum of 50 threads.
<Connector port="8080" maxThreads="50" minSpareThreads="10" maxSpareThreads="20"
               enableLookups="false" redirectPort="4443" acceptCount="100"
               debug="0" connectionTimeout="60000"
               disableUploadTimeout="true" />