Longitudinal Profile Display
Since release 2007.02 the Longitudinal Profile Display discussed below is not supported anymore. Time Series/Data display can be used to show the longitudinal profiles 04 Data Display and Data Editor
The FEWS Longitudinal display can be used to show time series, generated by hydraulic models for a longitudinal river profile,. stored in the FEWS data store. Another option is to generate a longitudinal profile in the time series display.
To show longitudinal profile data press the [Longitudinal Display ] button from the FEWS toolbar. When the Longitudinal Display is active you can see the following components on the Display:
- A list box with time series that can be displayed
- A graph component
- A Toolbar with the following options:
- Buttons to start a movie of the longitudinal time series, pause or stop the movie
- A slide bar that can be used to go forwards or backwards in time
- A time caption showing the exact time of the time step that is shown
- Two buttons to close the display or show the FEWS help file
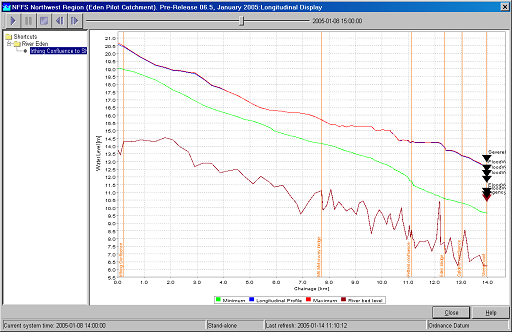
When a longitudinal profile is selected from the list the graph component is loaded with data for the selected profile:
- Brown line with the elevation of the river bed
- Green line with the minimum water levels of the selected profile time series
- Red line with the maximum water levels of the selected profile time series
- Blue line with the water levels of the time step shown in the slider.
When the play button is pressed the time series will be shown in the graph as a kind of movie.
When configured other information than the time series can be shown in the graph. From the above example can be seen that also information on the location of motorways or bridges is added as well as thresholds for a location located on the selected branch.