Schema location: http://fews.wldelft.nl/schemas/version1.0/performanceIndicatorSets.xsd
Performance Indicator module
The performance indicator module is used as an analysis tool in DELFT-FEWS to establish an overview of how well the forecasting system is performing in terms of accuracy of the individual forecasting module or in terms of the forecasting system as a whole. Performance can be assessed in two ways;
- Performance of the individual forecasting modules. This reflects how accurate a given forecasting module is, following the traditional performance measures used widely in module calibration, for example root mean square error, Nash-Sutcliffe measure etc.
- Performance of the forecasting system itself. This reflects the accuracy of the system in forecasting. Three types of measure are proposed to this end, (i) lead time accuracy of forecast time series, (ii) accuracy of timing threshold event crossings and (iii) accuracy and timing of peak predictions.
The first type of performance assessment can be used either in calibration of the system, or in the operational setting to determine performance of modules and take actions such as the use of an alternative module due to poor performance.
The second type of measure can be assessed once observed data for which forecasts were made becomes available.
Assessing performance of modules
The first and most simple application of the performance indicator module is in the traditional module calibration. This is by comparing two time series where one time series is the estimated series and the other is the reference time series. These time series are compared over a configurable length. As with other time series this is referenced with respect to the forecast start time (T0).
The time series are compared using a number of performance indicators.  is the estimated value,
  is the reference value, and
  is the number of data points.
  is the mean of the reference values.
Bias (BIAS)

Mean absolute error (MAE)

Mean Square error (MSE)

Nash-Sutcliffe efficiency (NS)

Peak accuracy in Mean Square Error MSE(MSE_PEAK)_

where K is the number of peaks identified.
To establish the peak accuracy, the peak must be identified- logic from the TransformationModule is to be used, although this needs extending to make sure a peak is a peak. A peak needs to be independent, and it must be ensured that the peak given is not simply the maximum value in a time window at the boundaries (see also Threshold Event crossing module). Note that the peak the estimated series does not need to fall exactly on the same time as the reference peak, but must be identified within a window (see peak independence window).
Procedure in peak comparison is
- Find peaks in reference series
- Find accompanying peaks in estimated series- if there is no identifiable peak, use value at time of peak in reference series
- Determine performance
Volume error (PERC_VOLUME)

On establishing the performance, the indicator is returned as a time series (simulated historical). This time series is a non-equidistant time series, labelled as a forecast historical with the time stamp set to T0
Assessing performance of forecast values- lead time accuracy
Performance of forecast is assessed on the basis of lead time accuracy. This is done by comparing the forecast lead time value against the observed value at the same time (received later!). For each lead time, this value is assessed over a given number of forecasts.
An option in the configuration of the module determines if the module identifies performance of approved forecasts only or of all forecasts.
Performance is assessed over all forecasts available for a given period of time- e.g over a week or month (relative view period). Clearly evaluation can not be done over forecasts beyond the length of the rolling barrel in the local data store.
Lead time accuracy is evaluated using again the BIAS, MSE, or MAE:
Lead time accuracy in bias (mean error) LEAD_BIAS

Lead time accuracy in Mean Square Error LEAD_MSE

Lead time accuracy in Mean absolute error LEAD_MAE

where  is the lead time accuracy at time
  , J is the number of forecasts considered,
  is the reference value at time and
  is the estimated value at time .
There are two options in writing results:
1. The results of the evaluation are written as a time series (simulated forecasting) , with as a reference time the T0 of the evaluation run and a time stamp for each .
2. The results for each lead time are written as a different time series (simulated historical). This will allow assessment of lead time accuracy at selected lead times to be compared against catchment conditions.
On selecting reference values , these may not yet be available (should this be the case then the number of forecasts considered (J ) is reduced accordingly. If less than the configured number is considered, then a WARN message indicating how many of the expected number were actually used.
Assessing performance of forecast values- timing of thresholds
An important indicator of performance is the timing of predicted threshold event crossings. Again this is evaluated over a number of forecasts. To evaluate this the threshold crossings in the indicator and the reference series are considered. For each pair of matching thresholds (matched on threshold id's) the time between the two is evaluated, and expressed either as a time bias (T_BIAS) or a time absolute error (T_MAE). Times are evaluated in terms of seconds.


where  is the time of the threshold in the reference series, is the time of the threshold in the estimated series.
The thresholds to consider is determined in configuration by providing one or more ThresholdID's
The results of the evaluation are written as a time series (simulated historical), with as a reference time the T0 of the evaluation run and a time stamp for each .
Assessing performance of forecast forecast precipitation
Performance indicators available:
- Root Mean Square Error
- Root Mean Square Factor
- Bias
(information to be added)
Assessing performance of forecast peak accuracy
(information to be added)
Configuration of performance module
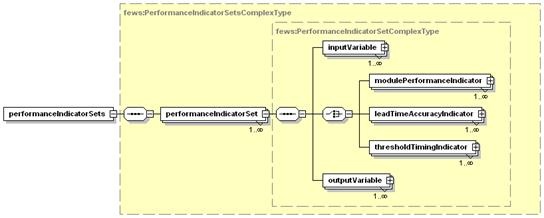
Figure 134 Elements of the performance module configuration
performanceIndicatorSet
Root element for configuration of a performance Module indicator. Multiple elements may be defined for each performance indicator to be assessed.
Attributes;
- performanceIndicatorId : Optional Id for the configuration. Used for reference purposes only
inputVariable
Definition of inputVariables (time series). Input variables are identified by their VariableId. See transformation module on definition of the inputVariable element. An input variable will need to be defined for both simulated and for observed time series.
outputVariable
Definition of outputVariable time series of performance indicator values is to be written to. This will normally be a non-equidistant time series as it is not a-priori certain when the performance indicator module is run.
modulePerformanceIndicator
Root element for configuration of performance indicator assessing module performance
Attributes;
- indicatorType : selection of performance indicator. Enumeration of options includes:
- bias
- meanabsoluteerror
- meansquareerror
- nashsutcliffeefficiency
- peakmeansquareerror
- volumeerror
- calculatedVariableId : VariableId to identify calculated time series
- observedVariableId : VariableId to identify observed (reference) time series
- outputVariableId : VariableId to write resulting Performance index time series to.
- sampleOutputVariableId : VariableId to write total number of values (samples) used for the analysis to the output time series. Optional.
- analysedCalculatedVariableId : VariableId to write exactly that part of the calculated series, which was used for the analysis, to the output series. Optional .
- analysedObservedVariableId : VariableId to write exactly that part of the observed series, which was used for the analysis, to the output series. Optional .
leadTimeAccuracyIndicator
Root element for configuration of performance indicator assessing lead time accuracy
Attributes;
- indicatorType : selection of performance indicator. Enumeration of options includes;
- bias
- meanabsoluteerror
- meansquareerror
- calculatedVariableId : VariableId to identify calculated time series
- observedVariableId : VariableId to identify observed (reference) time series
- outputVariableId : VariableId to write resulting Performance index time series to
- sampleOutputVariableId : VariableId to write total number of values (samples) used for the analysis to the output time series. Optional. NOTE: this option is not supported by all assessment types. In that case, there will be a nullpointer error.
- intermediateValuesVariableId : VariableId to write intermediate values (as visible in log file if debug is on) to the output series. Optional and only applicable if leadTimePeriods are configured.
- analysedCalculatedVariableId : VariableId to write exactly that part of the calculated series, which was used for the analysis, to the output series. Optional and only applicable if leadTimePeriods are configured.
- analysedObservedVariableId : VariableId to write exactly that part of the observed series, which was used for the analysis, to the output series. Optional and only applicable if leadTimePeriods are configured.
thresholdTimingIndicator
Root element for configuration of performance indicator assessing accuracy of threshold Timing
Attributes;
- indicatorType : selection of performance indicator. Enumeration of options includes;
- bias
- meanabsoluteerror
- meansquareerror
- calculatedVariableId : VariableId to identify calculated time series
- observedVariableId : VariableId to identify observed (reference) time series
- outputVariableId : VariableId to write resulting Performance index time series to.

Figure 135 Elements of the ModulePerformance configuration
additionalCriteria
Additional criteria identified in establishing performance indicators. Application depends on the performance indicator selected.
Attributes;
- Criteria : list of criteria that may be applied. Enumeration of options includes;
- minnumberofforecasts
- timewindowinseconds
- thresholdvaluesetid
- peakthresholdvalue
- maximumgapbetweenpeaksinseconds
- minimumrecessionbetweenpeaks
- value: value of criteria defined
- violationOfCriteriaFlaggedAs: optional flag applied to PerformanceIndicator output series if criteria identified (eg. minnumberofforecasts )__ do not hold. Enumeration of;
- unreliable
- doubtful
description
Description of criteria defined. For reference purposes only.

Figure 136 Elements of the leadTimeAccuracy configuration.
leadTimes
Root element for defining lead times.
leadTime
Lead time for which to assess lead time performance.
Attributes;
- time : lead time in number of time units from the forecast time of the calculated time series. The time units are configured with the attribute 'unit'
- outputVariableId: variableId to output lead time accuracy to. This is defined when a separate time series is defined to keep track of performance at different lead times. It is not required when keeping track of performance in a single time series (Note that in the former a simulated historical time series can be used. In the latter this must be a simulated forecasting time series).
leadTimePeriods
Root element for defining lead time periods
leadTimePeriod
Lead time period for which to assess lead time performance.
Attributes;
- start : start of the period in number of time units from the forecast time of the calculated time series. The time units are configured with the attribute 'unit'
- end : end of the period in number of time units from the forecast time of the calculated time series. The time units are configured with the attribute 'unit'
- outputVariableId: variableId to output lead time accuracy to. This is defined when a separate time series is defined to keep track of performance at different lead time periods. It is not required when keeping track of performance in a single time series
- sampleOutputVariableId : variableId to output number of samples used in this lead time period. This is defined when a separate time series is defined to keep track of performance at different lead time periods. It is not required when keeping track of performance in a single time series
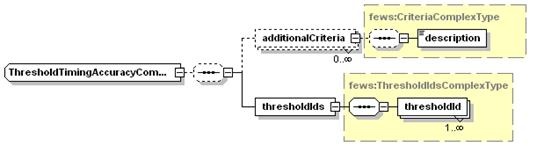
Figure 137 Elements of the thresholdTimingAccuracy configuration.
thresholdIds
Root element for defining threshold crossings to be assessed.
thresholdId
Configuration of threshold crossing to be checked.
Attributes;
- intId : Id of the threshold. See thresholds configuration in Regional Configuration.
- outputVariableId: variableId to output threshold timing accuracy to. This is defined when a separate time series is defined to keep track of performance for different thresholds. It is not required when keeping track of performance in a single time series (Note that in the former a simulated historical time series can be used. In the latter this must be a simulated forecasting time series).