What |
TimeSeriesDisplayConfig.xml |
|---|---|
Config group |
SystemConfigFiles |
Required |
no |
Description |
Configuration file for the time series display (line styles etc) |
schema location |
http://fews.wldelft.nl/schemas/version1.0/timeSeriesDisplay.xsd |
Introduction
The layout of the time series display is configured in an XML file in the SystemConfigurations section. When available on the file system, the name of the XML file is for example:
TimeSeriesDisplayConfig 1.00 default.xml
TimeSeriesDisplayConfig Fixed file name for the time series display settings
1.00 Version number
default Flag to indicate the version is the default configuration (otherwise omitted).
Figure 13 shows the main elements of the TimeSeriesDisplay configuration, These are divided into a number of sections, each of which will be discussed individually (these are indicated with a + sign). 
Figure13 Elements in the TimeSeriesDisplay configuration
description
An optional description of the configuration. This is for reference purposes only and will not be used elsewhere.
General Display Configuration

This includes global setting for the time series display.
convertDatum
This optional Boolean setting can be used to start the time series display showing levels against the global reference level. The default is that levels are displayed against the local reference level. The difference between local and global reference is defined in the locations definition (see regional settings).
maximumInterpolationGap
Maximum gapsize which can be filled in by linear or block filler in the data editor
valueEditorPermission
Optional permission which must be assigned to a user to to edit values in the data editor
lableEditorPermission
Optional permission which must be assigned to a user to to edit labels in the data editor
commentEditorPermission
Optional permission which must be assigned to a user to to edit comments in the data editor
Default view period
The optional default view period can be used to define the time span of data displayed in the time series display (unless overruled by the user).
Parameters
- unit identifies the time unit with which the time span is defined (enumeration of second, minute, hour, day, week).
- start identifies the start time of the time span with reference to the T0 (in multiples of the unit defined).
- end identifies the start time of the time span with reference to the T0 (in multiples of the unit defined).
Time Markers Display Configuration
Time series display markers are informative lines in the display. These may be defined to display vertical lines for times values of interest. The configuration of horizontal threshold lines is also included in this definition. Markers can be defined for three time values as well as for the thresholds;
for time series
- systemTime
- displayTime
- timeZero
- threshold
- forecastConfidence1
- forecastConfidence2
- forecastConfidence3
Within longitudinal profile displays, the markers can be set to display the minimum or maximum values. A variety of river bed levels can be included in a display if these are specifed in the branches.xml file.
for longitudinal profile:
- leftBankLevel
- leftFloodPlainLevel
- leftMainChannelLevel
- longitudinalProfileMaximum
- longitudinalProfileMinimum
- rightBankLevel
- rightFloodPlainLevel
- rightMainChannelLevel
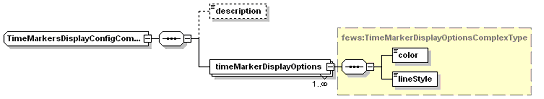
Figure 14 Elements in the TimeMarkersDisplay section of the TimeSeriesDisplay configuration
timeMarkerDisplayOptions
Root element of a definition time markers (multiple entries may exist).
Attributes;
- marker enumeration of the possible markers (see list above).
color
Colour of the time series marker line (see enumeration of colours in appendix A).
lineStyle
Line style of time series marker line. Enumeration of "solid", "none", "bar", "dashdot", "dashed", "dotted".
label
Define the name of time series marker line.
Parameters display configuration
In this section of the time series display, default attributes of lines plotted for parameters can be allocated. These defaults will be used when plotting lines for these parameters in the time series displays and in the reports. Note that for allocation of the colour only the preferred colour can be identified. When the line is plotted this colour will be used only if there is no other line with the same colour. If this is the case then the next colour in the colour palette will be used.

Figure 15 Elements in the ParameterDisplayConfig section of the TimeSeriesDisplay configuration
PreferredColor
The preferred colour for the line and markers. This colour will only be used if it is not yet available in the current graph. If it is, then the next colour in the template order will be selected.
lineStyle
Line style of time series line. Enumeration of "solid", "none", "bar", "dashdot", "dashed", "dotted".
markerStyle
Marker style for markers plotted on the vertices of the line. Enumeration of "none", "+", "x", "circle", "square", "rectangle", "diamond", "triangleup" , "triangledown".
markerSize
Size of the marker in points
Precision
Decimal precision with which values are given in the table.
min
Minimum of the y-scale to be used as a default for all displays of this parameter. The minimum is used, unless a value in the time series is lower than this minimum, in which case that is used. The minimum defined here can also be overruled in individual template definition in the DisplayGroups (see below).
max
Maximum of the y-scale to be used as a default for all displays of this parameter. This maximum is used, unless a value in the time series is higher than this maximum, in which case that is used. The maximum defined here can also be overruled in individual template definition in the DisplayGroups (see below).
Module instance mapping
The module instance mapping allows user defined strings to be defined which will display the moduleInstanceID in the legends of the time series display. This can help shorten legends, or add additional information.

Figure 16 Elements in the Log Panel section of the Explorer configuration
moduleInstanceMapping
Root element for each mapping to be defined.
Attributes;
- id ModuleInstanceId to be replaced
description
String to replace the module instance id in the legends
Statistical functionality
The Statistical functions group defines dedicated graphing options shown in the combo box in the toolbar:
- duration (i.e. sorted descending)
- duration non exceedence (i.e. sorted ascending)
- moving average (with associated time span).
- central moving average (with associated time span).
the (central) moving average function only works for true equidistant data (i.e. no daysOfMonths etc.)

The difference between moving average and central moving average is that the central moving average takes values before and after the current one. Mving average only uses values in the past.
The descriptiveFunctionGroup defines the contents of the descriptive tabel. Several sub-table can be configured (see sample).
Functions supported are:
Info functions (if this type of function is specified, the display provides a hint to select a column in the table in order to get more descriptive information):
- info: displays parameter (long name+id), location (long name+id)
- info_location_id
- info_location_name
- info_moduleinstance
- info_parameter_id
- info_parameter_name
Time series information available
- count: total number of populated records
- missings: total number of missings
- completed: number of records flagged as completed (gap filling)
- corrected: number of records flagged as corrected
- reliables: number of records flagged reliable
- unreliables: number of records flagged unreliable
- doubtfuls: number of recorsd flagged doubtfull
- start_time
- end_time
Basic statistics
- max
- mean
- min
- standard_deviation
- sum
- percentile: value exceeded X% of time (where the percentiles X are defined in the value-element)

for more details, a Word-attachement is available.