Skill Scores Display
This display provides an overview of all threshold crossings in the observed and forecast time series. By matching observed and forecast threshold crossing events, various skill scores can be computed.
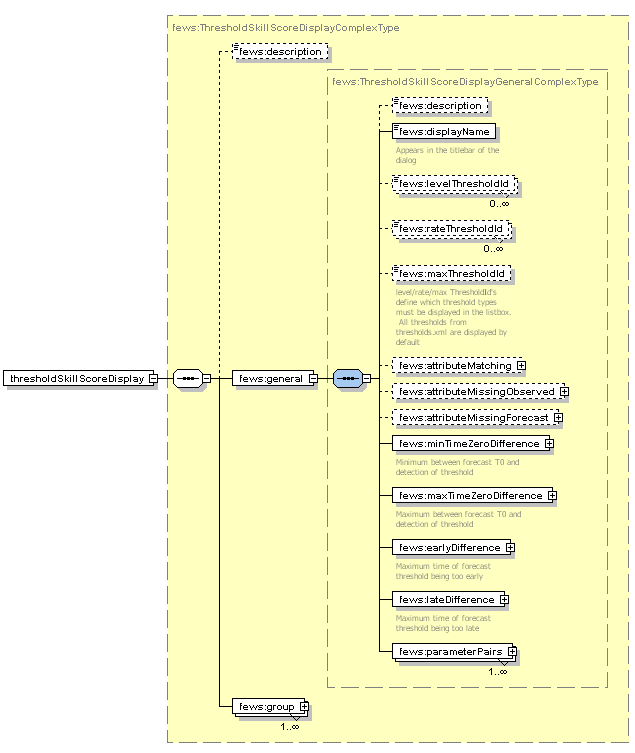
ThresholdSkillScoreDisplay 1.00 default.xml
ThresholdSkillScoreDisplay |
File name for the skill score display configuration |
1.00 |
Version number |
default |
Flag to indicate the version is the default configuration (otherwise omitted). |
Futher information on the use of the skill score display can be found in the 11 Skill Scores Display


Work in progress - Alex.
Background
The first step is to set up a contingency table. Given criteria on time intervals to consider when matching threshold crossing events, the values of a , b , c and d in the table below can be filled in (where e.g. a is the number of matched observed and forecast threshold crossing events).

Once the contingency table has been filled, different skill scores can be established:
 False Alarm Rate
 Probability of Detection
 Critical Success Index
 Critical Reliability (checks if a forecast is available at least some time (but not too late) before the observed threshold crossing)
The First Forecast of Threshold (FFOT) is determined as the average time between the T~0~ of the forecast run in which a threshold crossing was detected and the time of the observed threshold crossing (i.e. the average lead time of the category a threshold crossing events in the contingency table).
The Bias of paired threshold crossings is the average time between paired observed and forecast events.
Setting Criteria for Analyses
To specify what matching threshold crossings mean, a number of criteria can be used. When clicking the [Change Criteria] button the following display appears.

The criteria in the display have the following meaning.
- Min/Max T~0~ difference . These criteria define in what time interval the T0 of a forecast should fall that has predicted a threshold crossing in order for this threshold crossing event to be included in the analysis.
- Max dispatch time difference . This criterion is used to compute the Critical Reliability (CR) which determines whether a forecast was available at the time of an observed crossing irrespective of its quality. By setting this criterion the maximum time difference can be defined between the dispatch time of a forecast and the time of an observed crossing.
- Max time threshold being too early/late . These criteria define what the maximum difference between a forecasted threshold crossing and an observed threshold crossing are allowed to be in order to consider them as matching.
Matching Events
In the Matching Events tab different background colours are used to indicate in which sector of the Contingency Table events fall.
- green: observed and forecast threshold crossing event match (sector a of contingency table)
- yellow: a threshold crossing has been observed but not forecasted (sector c)
- orange: a threshold crossing has been forecasted but not observed (sector b)

In general, skill scores are determined for all forecast locations being at a gauging station and having level thresholds. Typically these are determined separately, but the structure of the display allows skill scores to be established for different models. This way the skill scores of the different models can be compared.
The performance indicators that are computed on the basis of the selection in this tab are:
- probability of detection
- false alarm rate
- critical success factor
- first forecast of threshold
- bias of paired thresholds
The filter boxes at the left hand side of the skill scores display enable the selection of certain locations or certain thresholds levels to be shown alone. By activating the check box below the criteria, it's possible to display Up crossings of thresholds only.
Forecast Available for Events
In the Forecast Available for Events tab different background colours are used to indicate in which sector of the Contingency Table events fall.
- green: a forecast is available for an observed threshold crossing event (sector e of contingency table)
- yellow: no forecast available for an observed threshold crossing event (sector f)
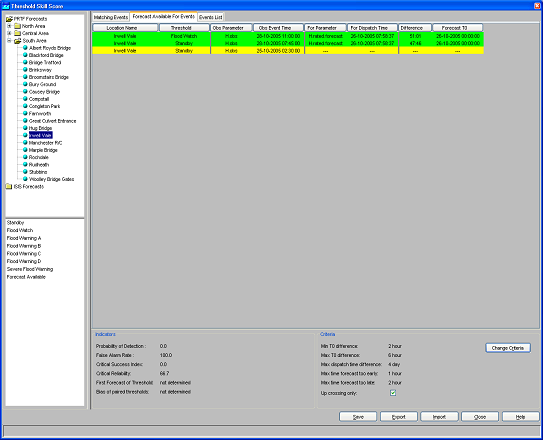
The performance indicator that is computed on the basis of the selection in this tab is critical reliability .
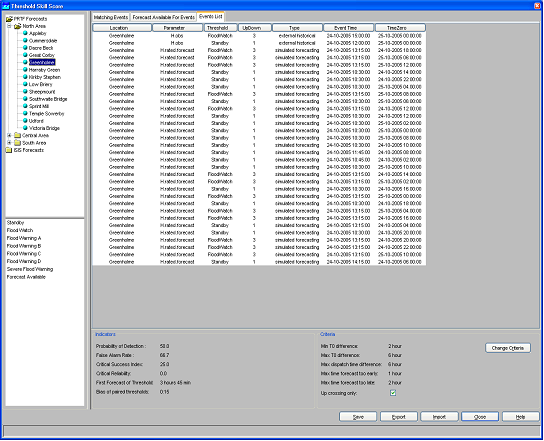
Thresholds List
The Threshold List provides an overview of all threshold crossing events available for the selected locations. In the analyses subsets can be made by setting the criteria discussed in the earlier part of this section.
Archiving Events
As the threshold crossing events are stored in the operational database for only some days (according to the length of the Rolling Barrel), it's possible to manually export the list of threshold crossing events by pressing the [Export ] button in the skill scores display. This list can later be imported in a Stand Alone system by pressing the [Import ] button. In this way, longer records can be established for analysis in an off-line modus.
Instead of exporting the whole list of threshold crossing events, as described above, it's also possible to select some of them and export only the selected ones by using the [Save ] button.
All threshold crossing events can also be archived automatically by the system. See also Archive Display.