| Anchor | ||||
|---|---|---|---|---|
|
| Anchor | ||||
|---|---|---|---|---|
|
...
| Note |
|---|
Since release 2007.02, the 02 the Longitudinal Profile Display discussed below is not supported anymore. Time Series/Data display is able to handle longitudinal profiles in both graph and tables. It therefore has overtaken the functionality of the Longitudinal Profile Display discussed belowdisplay can be used to show the longitudinal profiles. |
The longitudinal display is used in DELFT-FEWS for viewing longitudinal (vector) time series. These time series can be dynamically animated against.
...
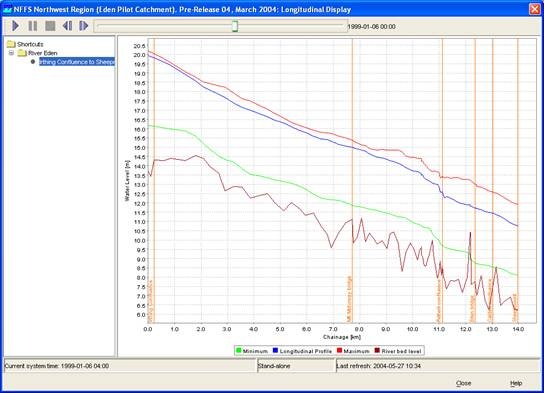
Figure 147 Example of a configuration of the Longitudinal Display

Figure 148 Root elements of the LongitudinalDisplay configuration
displayGroup
Root element for each displayGroup. A display group forms one of the main nodes in the tree view and may contain multiple displays. Multiple display groups may be defined.
...
Optional description of the configuration. Used for reference purposed only.
display
Root element for the configuration of a display within a group. Multiple displays may be defined in each group.
...

Figure 149 Elements of the display element of the LongitudinalProfile configuration
description
Optional description of the display. Used for reference purposed only
timeSeriesSet
Time series set to be displayed. This should be a longitudinal time series. The location Id of the time series set must refer to a Branch definition to allow an x-axis to be defined (see Regional configuration).
xaxis
Unit to display the xaxis in. Enumeration of "m" and "km".
thresholds
Thresholds may be plotted in the display for identified branch points. If this item is included, then a list of thresholds to be displayed can be configured.
threshold
Identifier for threshold to be plotted. Attribute is the threshold id, which is a reference to a thresholdValueSet defined in the ThreholdValueSets (see Region configuration).
branchLabel
Label in the branch (See branch definition in Region configuration) where the thresholds are to be plotted.