...
The types of modifier that are available are:
• Add - allows a value to be added to the original data for a defined time span.
• Subtract- allows a value to be subtracted from the original data for a defined time span
• Multiply - allows a value to be given with which original data is multiplied for a defined time span.
• Divide - allows a value to be given with which original data is divided for a defined time span.
• Replace - allows a value to be given that replaces the original data for a defined time span.
• Missing - allows the original values with missing data for a defined time span.
• Time Shift Typical Profile - allows a time increment to be defined with which the original data is to be shifted (not yet available2022.01).
• Edit - allows a time series of values to be defined either as a table of values or through interactive editing on the graph, which replace the time series for a defined time span.
...
Start and end times selected are displayed as vertical lines in the display.

Modifier enable start and end time
By default the modifier is valid for the same period as the start and end time of the modifier. However, a modifier can be set to be valid during a different period than the data to which it applies. A modifier will only be applied to the data if the Forecast T0 of the workflow falls within the valid period.
The period of validity can be entered as a start and end time in the appropriate text fields.
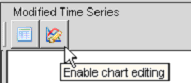
Editing data interactively
The time series modifier display allows the data to be edited interactively. Once the Edit operation has been selected, data can be manually edited in two ways.
To enter data by clicking on graph, choose the Enable chart editing option. Use the mouse to draw the changed data on the display.
To enter data by entering data in a table, select the Enable table editing option. Enter the changes through the table. The column that contains the location & parameter selected is shown with the values against a white background. All other columns remain with a grey background.
Once editing the data is complete, select the Create button to add the new modifier.
Managing modifiers
Through the Modifiers tab the modifiers defined can be managed. Following definition, the modifiers will have a temporary status. In the Modifiers tab these are displayed with a blue square. Temporary modifiers are not available for use until these have been confirmed using the Apply button.
Modifiers that are available for use are preceded with a green square.
The remaining columns of this tab show the relevant details of the modifier. Each modifier can be enabled or disabled using the Active option.
When hovering over the information icon a pop-up is displayed with the description entered previously. If no description has been entered this icon is greyed.
A modifier can be deleted through the red cross in the last column.
Note that if there are modifiers that have only a temporary status, the name of the tab will be marked in blue. Once these have all been Applied the colour of the text will revert to black.

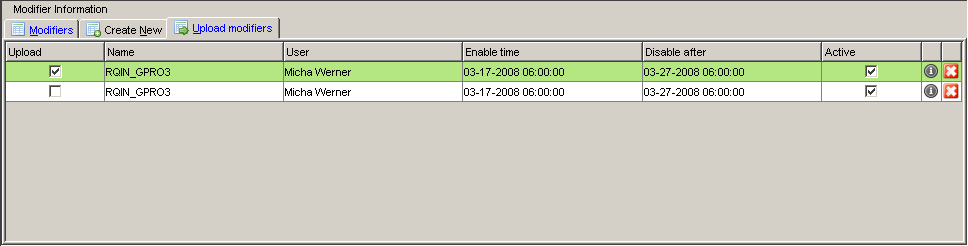
Uploading modifiers
Modifiers defined on the local client will only be available on that client until these have been uploaded to the central database. Through the Upload Modifiers tab the modifiers which are considered to be used in forecast and historical runs on the central server system can be selected and uploaded.
Once modifiers have been saved locally using the Apply button, these are available for uploading. This displays only those modifiers that have not yet been uploaded. The modifiers to be uploaded can be selected using the Upload option. Select the Upload option to send these to the central database and use throughout the system. Following upload the modifiers will be removed from the list displayed in this tab.
Constraints
Multiple modifiers can be applied to the same location & parameter. However, these will not be applied cumulatively if there is an overlap. In case of an overlap the last modifier defined that is active will be applied.
Once a modifier has been defined it cannot be changed. At any time the modifier can be enabled and disabled, or deleted.
Configuration of the Time Series Modifiers Display
As the time series modifiers is a central component to the Delft FEWS system, its configuration is quite simple. No additional configuration need be added. The display does require preconfigured displays to be defined using the Display Groups configuration as the time series defined in these display groups are available for applying modifiers to.
Making this display available only requires the relevant class be called from the Explorer. It is added as an explorer Task.
An example of the configuration is provided below
| Code Block | ||||
|---|---|---|---|---|
| ||||
<explorerTask name="Modifier Display">
	<iconFile></iconFile>
	<mnemonic>X</mnemonic>
	<displayConfigFileName>ModifiersDisplay</displayConfigFileName>
    <toolbarTask>true</toolbarTask>
	<menubarTask>true</menubarTask>
	<accelerator>ctrl X</accelerator>
	<loadAtStartup>true</loadAtStartup>
</explorerTask>
|
Note that the use if Icons and Mnemonics, as well as the name of the display will depend on the configuration.