...

Figure 143 Example of a configuration of the Grid Display
Besides plotting a grid in the grid display, it is also possible to plot scalar data (Figure 10) and longitudinal profiles (figure 9).
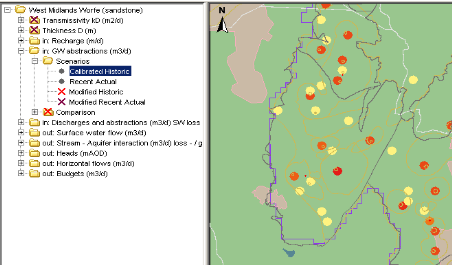
Figure 010 Example of a configuration of the scalar data in Grid Display

Figure 009 Example of a configuration of the longprofile in Grid Display
...