Grid display
The grid display is used in DELFT-FEWS for viewing grid time series. These grid time series can be dynamically animated against a map background (comparable to the main map display).
The Id of the grid display is identified in the DisplayInstanceDescriptors. When available on the file system, the name of the XML file for configuring the GridDisplay with an Id of FloodMapDisplay is for example:
FloodMapDisplay 1.00 default.xml
FloodMapDisplay |
File name for the Flood Map display configuration |
1.00 |
Version number |
default |
Flag to indicate the version is the default configuration (otherwise omitted). |

Figure 143 Example of a configuration of the Grid Display
Besides plotting a grid in the grid display, it is also possible to plot scalar data (Figure 10) and longitudinal profiles (figure 9).
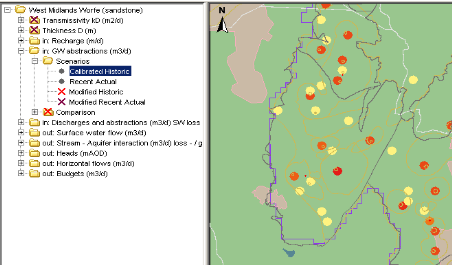
Figure 010 Example of a configuration of the scalar data in Grid Display

Figure 009 Example of a configuration of the longprofile in Grid Display

Figure 144 Root elements of the gridDisplay configuration
title
Name of the Grid Display. When opened this will appear in the title bar of the window.
gridPlotGroup
Definition of a group in the grid display. Each group may have its own set of maps and time series to display. Defining groups creates a tree view in the left of the display (see example above). Multiple instances may exist.
Attributes;
- id : Id of the display group- this is used in the tree view.
- name : Optional name of the display group- used for reference purposes only
description
Optional description of the display group/grid plot. Used for reference purposes only
gridPlot
Definition of a grid plot within the display group. Each grid plot forms a node in the tree view. When a gridPlot is selected, the appropriate maps will be displayed and the time series data retrieved from the database.
Attributes;
- id : Id of the grid plot- this is used in the tree view.
- name : Optional name of the grid plot- used for reference purposes only
timeSeriesSet
Definition of the time series set to be displayed in the selected grid plot. This must obviously be a grid time series.
classBreaks
Definition of colours to use in displaying the dynamic grid. These are also shown in the legend on the left of the grid display (see example above).
geoMap
Definition of the maps used as a background to the dynamic grid displayed. The layout and zoom extent are also defined in this element.
Definition of class breaks

Figure 145 Elements of the configuration of class breaks
description
Optional description of the configuration. Used for reference purposes only.
lowerColor
Colour definition for the colour in the legend associated to the lowest value in the range.
upperColor
Colour definition for the colour in the legend associated to the highest value in the range.
lowerValue
Definition of the value at which the colour in the grid displayed changes. The legend will be a gradual change in colours from the lowest colour to the highest colour, with the number of increments determined by the number of lowerValue items entered. Multiple entries may exist
Definition of background maps
The background maps to be displayed are defined in the geoMap element. This is an XML implementation of the OpenMap configuration described also in Appendix C for configuring the main map display (in time this will also be done using the geoMap element).

Figure 146 Elements of the geoMap configuration
description
Optional description of the configuration. Used for reference purposes only.
extents
Root element for the definition of a zoom extent. The extents defined will appear in a drop down list in the grid display.
geoDatum
Coordinate system the extents are defined in. Enumeration of available coordinate systems is available in Appendix B.
defaultExtent
Definition of the default zoom extent.
Attributes;
- name : name of the default zoom extent (displayed in the drop-down list)
extraExtent
Definition of the additional zoom extents. Multiple entries may exist.
Attributes;
- name : name of the zoom extent (displayed in the drop-down list)
left, right, top, bottom
Coordinates of the zoom extent. Note that in displaying the maps for the extent defined, the map display will be scaled to fit the extent in the current display window.
layer
Definition of a GIS layer to be displayed.
Attributes;
- id : required id of the map layer- must be unique for the current geoMap element.
- name : optional name of the map layer defined
description
Optional description of the map layer. Used for reference purposes only.
className
Name of the class used in displaying the map layer. A different class is required for different types of GIS data.
NOTE: Defining a class name allows advanced users to add additional display functionality to the OpenMap utility, and this being used in map displays in DELFT-FEWS. See the OpenMap documentation for details on how to add additional display classes.
visible
Boolean flag indicating if layer is visible by default.
properties
Definition of properties associated with the map layer to be displayed. Properties that need to be defined depend on the class used. At least one property must be defined. This may be a dummy property. Multiple entries may exist.
string
Definition of a string property. An example is the definition of the geoDatum for displaying shape files using the geoDatumDisplay class.
key
Key to identify the property
Value
Value of the property defined.
Note: when displaying a shape file layer that does not use WGS 1984 as the coordinate system, a property must be defined that defines the geo datum. To do this set the key value as "geoDatum" and define the coordinate system using the enumeration in Appendix B.
Configuration (Example)
The following example shows how to configure a Meteosat image as grayScaleImage in the Grid display.
<gridPlotGroup id="Meteosat Images">
	<gridPlot id="MeteoSat">
		<timeSeriesSet>
			<moduleInstanceId>ImportMeteosat</moduleInstanceId>
			<valueType>grid</valueType>
			<parameterId>image</parameterId>
			<locationId>meteosat</locationId>
			<timeSeriesType>external historical</timeSeriesType>
			<timeStep unit="minute" multiplier="15"/>
			<relativeViewPeriod unit="hour" start="-12" end="36"/>
			<readWriteMode>read only</readWriteMode>
		</timeSeriesSet>
		<classBreaks>
			<lowerColor>black</lowerColor>
			<upperColor>white</upperColor>
			<lowerValue>0</lowerValue>
			<lowerValue>8</lowerValue>
			<lowerValue>16</lowerValue>
			<lowerValue>24</lowerValue>
			<lowerValue>32</lowerValue>
			<lowerValue>40</lowerValue>
			<lowerValue>48</lowerValue>
			<lowerValue>56</lowerValue>
			<lowerValue>64</lowerValue>
			<lowerValue>72</lowerValue>
			<lowerValue>80</lowerValue>
			<lowerValue>88</lowerValue>
			<lowerValue>96</lowerValue>
			<lowerValue>104</lowerValue>
			<lowerValue>112</lowerValue>
			<lowerValue>120</lowerValue>
			<lowerValue>128</lowerValue>
			<lowerValue>136</lowerValue>
			<lowerValue>144</lowerValue>
			<lowerValue>152</lowerValue>
			<lowerValue>160</lowerValue>
			<lowerValue>168</lowerValue>
			<lowerValue>176</lowerValue>
			<lowerValue>184</lowerValue>
			<lowerValue>192</lowerValue>
			<lowerValue>200</lowerValue>
			<lowerValue>208</lowerValue>
			<lowerValue>216</lowerValue>
			<lowerValue>224</lowerValue>
			<lowerValue>232</lowerValue>
			<lowerColor>orange</lowerColor>
			<upperColor>red</upperColor>
			<lowerValue>240</lowerValue>
			<lowerValue>248</lowerValue>
			<lowerValue>255</lowerValue>
		</classBreaks>
	</gridPlot>
</gridPlotGroup>