Zebra mussel - Dreissena polymorpha
General
Algemene kenmerken |
|
|---|---|
Common name |
Zebra mussel - Dreissena polymorpha |
Region |
The Netherlands, Europe |
Watersystem |
meren, rivieren |
Nature parameter |
molluscs |
Factsheet made by |
K.E. van de Wolfshaar, M. Haasnoot |
|
Photo: Ron Offermans Bron:kennislink.nl |
Descripton habitat
Occurence
The zebra mussel lives in rivers, lakes, pools and canals and attaches itself to solid substrates. In winter, zebra mussels are consumed in large quantities by water birds, such as the Tufted Duck (Aythya fuligula), the Common Pochard (A. Ferina), the Greater Scaup (A. marila) en the Eurasian Coot (Fulica atra). It is a small freshwater mussel that lives in fresh, large stagnant waters in the lower river basin.
Environmental boundary conditions
Fresh water, soil type, water depth and water temperature are important environmental conditions for the zebra mussel 2, 6.
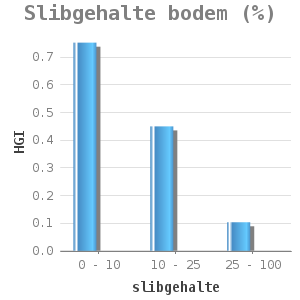
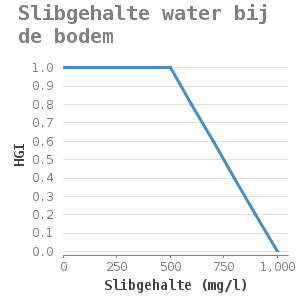
They attach themselves to solid substrate such as rocks and shells. Zebra mussels are filter-feeding organisms, they remove algae from the water column. Water and soil that contain high silt concentrations hinder filter-feeding and can eventually cause suffocation. Lab experiments on mussel filtration of the zebra mussel under various inorganic silt concentrations showed that the filtration capacity of the zebra mussel decreases with increasing silt concentrations (11). A silt concentration of more than 1g/l hinders the filtration. These concentrations result not only in slow silt filtration but also in slow green algae filtration (11). This way, the mussels might not obtain enough food (as they are too busy with the removal of silt through pseudofaeces) which can lead to a lack of growth or even death.
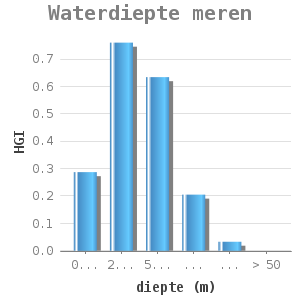
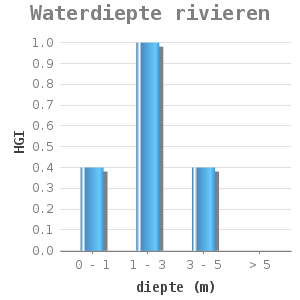
Most mussel colonies grow at various depths varying per area. There are reports of mussels at a depth of 50 metres (9. Most concentrations can be found at a depth of 2-5 metres (2). The zebra mussels do not occur in shallow areas, probably because of rapid temperature changes, mussel predator pressure or a high mortality rate in winter as a result of a long anaerobic period due to ice covering (8). At larger depths, temperature and oxygen level are often limiting factors (10).
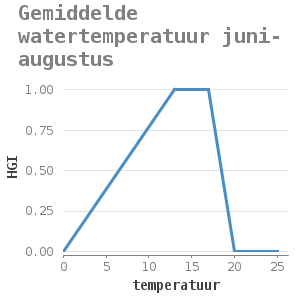
The water temperature influences the growth and reproduction of zebra mussels 2. The growth period is short and reproduction is minimal in cold water (<15˚C), Morton, 1969; Lewandowski, 1982; Strayer, 1991). Warm waters also have a negative effect on their reproduction (Walx, 1974). Mortality rate increases when temperature rises above 26-32˚C (Strayer, 1991). Noordhuis and Houwing (2003) suggest that relatively warm winters might have a negative effect. In Polish lakes, eggs and larval have been reported at water temperatures of 17-19 ˚C (Lewandowski, 1982) and in North American lakes at 13˚C (Hebert e.a., 1989).
For the lake Ijssel, the yearly spring growth of the zebra mussels start in April and ends in September. Research by Reeders (1989) showed that filtration rate is optimal at a water temperature of 5-20˚C. Filtration rates abruptly decrease if the temperature drops below 5˚C. When temperature is above 20˚C, the rate gradually decreases. According to research (Morton, 1969), longitudinal growth only takes place at a water temperature above 11 ˚C and it comes to a complete stop when the water temperature is over 30˚C. The zebra mussel is extremely sensitive for rapid water temperature rises. Therefore, the thermal shock method is used to control zebra mussels in cooling water systems: at a temperature of 35˚C all new growth is dead within half an hour (Jenner en Mommen, 1985). The growth of zebra mussels in the Randmeren is limited by a number of factors, including rapid water temperature rise and large daily temperature fluctuations, which can occur in shallow and sheltered lakes in spring. These changes can completely disturb the reproduction of zebra mussels (Vanhemelrijk e.a., 1993).
Beheer en ontwikkelingskansen
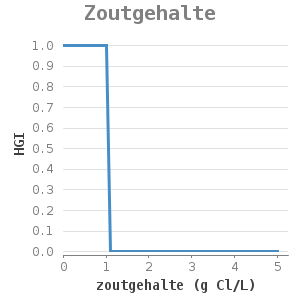
Met name veranderingen aan zoutgehalte, waterdiepte en watertemperatuur kunnen tot een verandering van het voorkomen van de driehoeksmossel leiden.
Dosis-effect relaties
Deze dosis-effect relaties zijn gebaseerd op een uitgebreide studie van TNO (2) en een expert meeting (3).
Er wordt onderscheid gemaakt voor meren en rivieren voor waterdiepte en stroomsnelheid 2.
Stroomdiagram
graph[
rankdir=LR]
nodesep=0.5
"node0" [
label = "Bodemtype|Schelpen in bodem"
shape = "record"
];
"node3" [
label = "HGI vestiging"
shape = "record"
];
"node0":f1-> "node3" [style=italic,label="maximum"]
[
id = 2
];
graph[
rankdir=LR]
nodesep=0.5
"node0" [
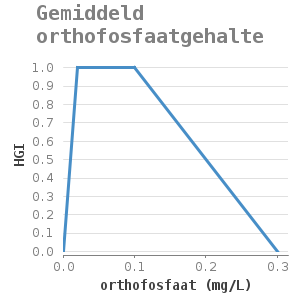
label = "Zoutgehalte|Gemiddelde watertemperatuur juni tot augustus|Gemiddeld orhofosfaat|Gemiddeld zuurstofgehalte|Slibgehalte water bij de bodem|Slibgehalte bodem|HGI vestiging"
shape = "record"
];
"node3" [
label = "HGI algemeen"
shape = "record"
];
"node0":f1-> "node3" [style=italic,label="minimum"]
[
id = 2
];
graph[
rankdir=LR]
nodesep=0.5
"node0" [
label = "Waterdiepte"
shape = "record"
];
"node3" [
label = "HGI meren extra"
shape = "record"
];
"node0":f1-> "node3" [style=italic,label="minimum"]
[
id = 2
];
graph[
rankdir=LR]
nodesep=0.5
"node0" [
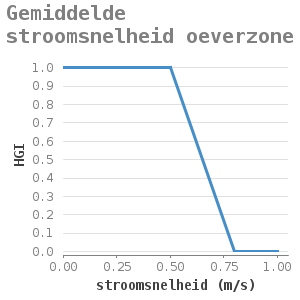
label = "Waterdiepte|Gemiddelde stroomsnelheid oeverzone"
shape = "record"
];
"node3" [
label = "HGI rivieren extra"
shape = "record"
];
"node0":f1-> "node3" [style=italic,label="minimum"];
Algemene dosis-effect relaties


Toegevoegde dosis-effect relaties voor meren
Onzekerheid en validatie
Deze dosis-effect relaties zijn gevalideerd voor het IJsselmeer (4) en Markermeer (5, 7). In deze validatie is voor het IJsselmeer nog geen effecrelaties voor slibconcentraties meegenomen.
Voor de validatie van het Markermeer zijn de effectrelaties voor slibconcentraties wel meegenomen. Echter, de slibconcentraties zijn bekend voor het jaar 2007 en de driehoeksmosselmeting is gedaan in 2004. Nieuwe driehoeksmosseldata is te verwachten in 2010/2011. Nieuwe validatie is dan nodig, wat waarschijnlijk leidt tot een betere predictie van het model, doordat mismatch van het model van de meetdata nu vooral plaats heeft op de plaatsen waar volgens het model slib limiterend is voor de groei van driehoeksmosselen.
aanwezigheid goed voorspeld |
0.69 |
|---|---|
afwezigheid goed voorspeld |
0.80 |
aanwezigheid fout voorspeld |
0.31 |
afwezigheid fout voorspeld |
0.20 |
Hierbij is aanwezigheid van de driehoeksmossel in het model gezet op een habitatgeschiktheid van 0.5.
Toepasbaarheid
Deze dosis-effect relaties zijn toepasbaar op zoete wateren in Nederland.
Voorbeeld project
Volkerak-Zoommeer Habitat analyse (1).
Seizoensgebonden peil in het IJsselmeergebied (12)
Referenties
1 Haasnoot, M. en Van de Wolfshaar, K.E.. Habitat analyse in het kader van de Planstudie/MER voor Krammer, Volkerak en Zoommeer. WL report Q4015. 2006
2 Duel, H. en Specken B.. Habitatmodel Driehoeksmossel en andere modellen voor het voorspellen van de populatie-omvang van de Driehoeksmossel Dreissena polymorpha in meren en rivieren. TNO-BSA werkdocument P94-026 1994
3 Van der Lee, G., H. Duel, S. Groot, H. Aarts, R. Pouwels (2000). Kwaliteit van het HEP-instrumentarium voor toepassing in het IJsselmeergebied. WL | Delft Hydraulics, WL-rapport T2391
4 Haasnoot, M. (2004) Memo validatie rekenregels Driehoeksmossel IJsselmeer.
5 Van de Lee, G., H.F.P. van den Boogaard, W.E. Penning (2001). Achtergronddocument voor aanvulling van het habitatinstrument: 1. Flexibilisering invoer; 2. Onzekerheidsanalyse; 3. Validatie. WL rapport Q3433
6 Noordhuis, R. & EJ. Houwing, 2003. Oorzaken en gevolgen van een vermoedelijke "crash" met betrekking tot waterkwaliteit, slibhuishouding en natuurwaarden. RIZA rapport 2003.016, Lelystad.
7 Van de Wolfshaar, K.E., M. Haasnoot, 2007. Toetsing dosis-effect relaties HABITAT. Pilot voor het Markermeer en de Voordelta. WL-report Q4327. Download![]()
8 Strayer, D.L. (1991). Projected distribution of the zebra mussel. Dreissana polymorpha, in North America. Can. J. Fish. Aquati. Sci. 48:1389-1395.
9 Laane, W.E.M. (1994). Habitatmodellen Driehoeksmossel, Hydropsyche contubernalis en Oeveraas. RIZA werkdocument, 96.044x.
10 Sprung, M. (1994). The other life: An account of present knowledge of the larval phase of Dreissana polymorpha. Ch.2 in Zebra Myssels, biology, impacts and control. Ed. by Nalepa F. and Schloesser D.W. pp 39-53
11 [Dionisio 2009 Memo slibinvloed op driehoeksmosselen|^Memo Slibinvloed driehoeksmosselen.doc]
12 Haasnoot et al (2005) Seizoensgebonden Peilen in het IJsselmeergbied Download![]()