Vaklodingen bathymetry data in OpenEarth:
- Raw data + scripts (ascii + Matlab)
- Raw ascii data + Matlab tools for conversion to netCDF
https://svn.oss.deltares.nl/repos/openearthrawdata/trunk/rijkswaterstaat/vaklodingen/ (register at oss.deltares.nl)
- Raw ascii data + Matlab tools for conversion to netCDF
- Standardized data (netCDF on OPeNDAP). The netCDF files can be viewed and analyzed interactively with UCIT.
- 2012 release is upcoming, to be processed with the new
nc_genin Matlab OpenEarthTools - 2011 release: production: http://opendap.deltares.nl/thredds/catalog/opendap/rijkswaterstaat/vaklodingen_remapped/catalog.html (processed with with
nc_multibeamtoolbox in Matlab OpenEarthTools) - 2010 release: production: http://opendap.deltares.nl/thredds/catalog/opendap/rijkswaterstaat/vaklodingen/catalog.html (generated with abandoned processing line in Python)
- 2010 release: test: http://dtvirt5.deltares.nl:8080/thredds/catalog/opendap/rijkswaterstaat/vaklodingen/catalog.html (processed with with
nc_multibeamtoolbox in Matlab OpenEarthTools)
- 2012 release is upcoming, to be processed with the new
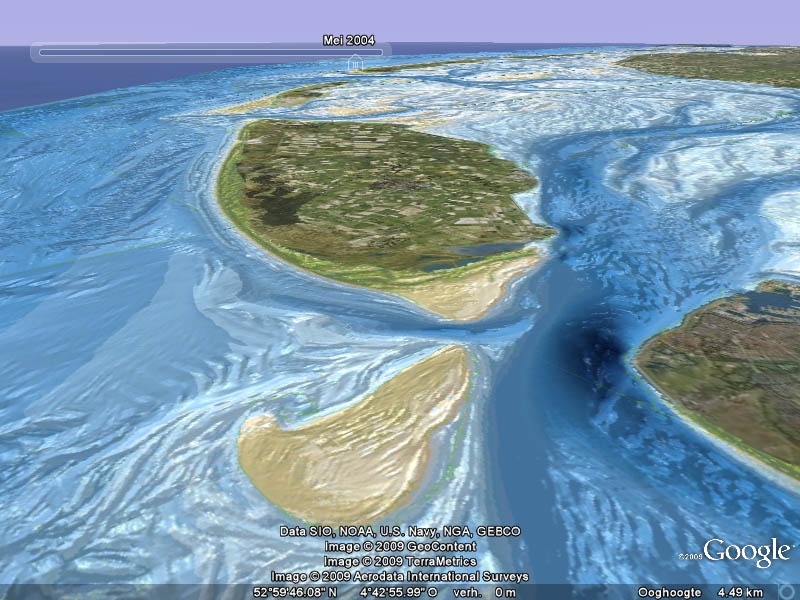
- Visualized data (kml) (only 2010 release)
- Vaklodingen overview (with links to OPeNDAP): http://dtvirt5.deltares.nl/kml/rijkswaterstaat/Vaklodingen_overview.kml
- All Vaklodingen data as tiled pngs, the same technology that Google Earth uses for all aereal imagery: http://dtvirt5.deltares.nl/kml/rijkswaterstaat/Vaklodingen.kml
Note there is a small kick-up in this release: Zoom out to unitll you see the entire globe, and then zoom in (Google Earth must first show uppermost Vaklodingen tile).
Vaklodingen description:
- Rijkswaterstaat functional design Maria processing software (matlab). rws.nl
- Rijkswaterstaat report in visualizing Vaklodingen. rijkswaterstaat.nl
- Rijkswaterstaat note on bathymetry accuracy for NAM http://www-static.shell.com/static/nam/downloads/pdf/monitoring/2010_rws_memo_vaklodingen.pdf
See also: