Still to document SubPlotAreaComplexType, TimeSpanComplexType and update of the displayComplexType
Introduction
A list of pre-configured displays can be configured in the Display groups. When available on the file system, the name of the XML file is for example:
DisplayGroups 1.00 default.xml
DisplayGroups Fixed file name for the explorer settings
1.00 Version number
default Flag to indicate the version is the default configuration (otherwise omitted).
The pre-configured displays are organised in a tree view in the time series display (see example in Figure 1). Each pre-configured display is identified by its name, and may include one or more subplots, each with one or more time series lines.

Figure 1 Example of time series display, showing two sub-plots and tree-view of pre-configured displays
Another option is to plot a longitudinal profile in the time series display (see figure 2). The main difference with the normal time series plot is, that on the X-axis the river chainage is plotted. With the control toolbar a specific time step can be selected.

Figure 2 Example of time series display, showing longitudinal profile.
The display groups are configured by first listing the names of the filters to be shown in the display (for example "Rain gauges", "Gauges" and "Fractions" in figure 3 below) under the displayGroup descriptor. The names of the subplots can then be added (e.g. "MacRitchie" and "Woodleigh" below). Each of the subplots is assigned a plotId which links to the definitions of the plots and the time series set to be used. For example in the Fractions displayGroup a stackPlot is defined with a max and min (this file is attached as an example). Please note that the colours, linestyle, precision etc are defined in the TimeSeriesDisplayConfig.
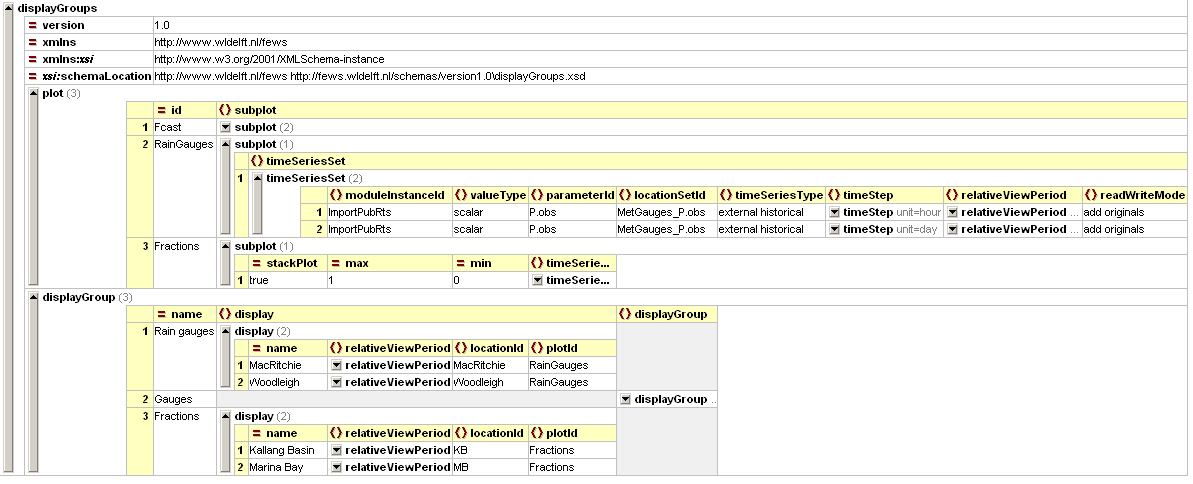
figure 3 - example of a configured displayGroup file

Figure 4 Root element of the display groups definition
displayGroups
Root element for each displayGroup. A display group forms one of the main nodes in the tree view and may contain multiple displays. Multiple display groups may be defined.
Attributes;
- description: Optional description
- plot: Plot complex type
- displayGroup: displayGroup complex type
plot
Defines the plots relating to the displayGroup

Attributes;
- description: Description of plot
- legendFontSize: Font size of legend
- axis TitleFontSize: Title font size
- tickLableFontSize: Option to change tick label font size
- subplot: Link to subplot complex type.
displayGroup
Defines the groups of plots to be viewed (i.e. the branches of the shortcuts in the display) 
Attributes;
- description: Optional description
- display: Display complex type
- displayGroup: displayGroup which links to the plot id
subplot
Root element for each subplot. Multiple sub-plots may be defined per display.

Attributes;
- description
- axisScaleUnit
- lowerMarginPercentage:
- upperMarginPercentage:
- thresholdAxisScaling
- forecastConfidenceTimeSpan: TimeSpanComplexType
- area: SubPlotAreaComplexType. Displays the extent of multiple time series as a single area
- color: Overides colours specified in the timeseriesdiplay
- lineSytle: Overides line style in the timeseriesdisplay
- timeSeriesSet
display
Definition of a pre-configured display. Each display may contain multiple sub-plots. Multiple displays may be defined per display group.
Attributes;
- name: name of the display (used in the tree view)

Figure 4 Elements in the Display section of the DisplayGroups configuration
subplot
Root element for each subplot. Multiple sub-plots may be defined per display.
timeSeriesSet
Definition of the time series set to be displayed. This scalar or polygon time series set shows a graph with the X-axis representing time. A time series set of type longitudinal profile results in a graph, to be animated, with river chainage on the X-axis. See section 3.3 for a description of the time series set definition.
color
Colour of the time series marker line (see enumeration of colours in appendix A).
lineStyle
Line style of time series marker line. Enumeration of "solid", "none", "bar", "dashdot", "dashed", "dotted".
Display groups may be defined while DELFT-FEWS is running and reloaded by re-opening the time series dialogue. If a mistake is made, then the shortcuts item to open the tree view will not appear and an appropriate message will be generated. After resolving the mistake the item will again become available on re-loading the display.
Making stacked graphs
Since 2007/02 release.
The only thing needed to implement this is to add a stackPlot="true" attribute to a subplot element. An example is given below:
Example config. file (from DisplayGroups.xml) :
<subplot stackPlot="true">
<timeSeriesSet>
.........
</timeSeriesSet>
<timeSeriesSet>
..........
</timeSeriesSet>
</subplot>
If stackPlot is True, the timeseries of this subplot are plotted as stacked areas, except for the timeseries that are specified inside the (optional) element <area>. Area-series are always plotted as so called 'difference area'.
Attribute stackPlot is intended as overruling of the default series paint (i.e. line or bar)
It is not possible to combine 'stacked areas' and lines/bars in one plot.