
Introduction
This tool can be used to compute the Habitat Suitability Index (HSI) in a response map for a selected species. The HSI is a non-dimensional index (ranging from 0 to 1), indicating the habitat suitability of a certain species (0 being 'not suitable at all' up to 1 being 'perfectly suitable'), which is presented spatially within the response map.
The HSI is computed through relations between domains (variables) and the selected species. These relations are stored in response curves, which are specific for each species and the domains (variables) it depends on.
The values associated with a domain (variable) are stored in a domain map, consisting of spatial information (a point cloud or single value in eCoDeS).
Upon calculating, a response map for the selected species is presented. If a species is dependent on multiple domains, the response curves are combined to obtain the total response map.
Glossary of terms
| Species | The species (or groups) for which the HSI is calculated. |
| Response curves | The relation between a species and a domain (variable). For example: A certain type of vegetation (species) which is dependent on water depth (domain/variable). |
| Domain map | Spatial information (point cloud) for a particular domain, e.g. water depth, salinity. |
| Response map | Spatial information (point cloud) of HSI [0-1], calculated by multiplying the domain map with the response curve. A response maps can also be used as a new domain map for chaining HSI's: e.g. vegetation is related to water depth; And a mussel is related to vegetation. |
| HSI | Habitat Suitability Index. An index ranging from 0 to 1, indicating the suitability of a species, as presented in a response map. |
Species response curves are a critical component of eCoDeS, as they describe the relation between a certain parameter and the HSI response map.
Many examples of species response curves can be found in the Ecological knowledge base of the HABITAT model.
The eCoDeS tool applies principles (explained above) that are also used in the HABITAT tool. Though the main difference with the HABITAT tool is that eCoDeS also has the capability to use unstructured spatial data (point clouds).
How to use the tool
To assess the habitat suitability index for a certain species, the following steps are needed:
- Load/create domains map(s)
- Load/create a species and associated response curves
- Generate HSI response map for the species
- If needed use the output for another specie and repeat step 2 and 3
Below, these steps are explained in detail.
1. Load/create domain map(s)
Domain maps datapoints are always based on the spatially varying bathymetry from generic data.
Therefore, eCoDeS requires loading or defining a spatially varying bathymetry (either loaded as raster or point cloud data) in generic data. Find more information here.
Note: point-clouds with large amounts of points (>10.000 points) can be slow due to computational time.
An example of a loaded point cloud bathymetry of the Western Scheld region is shown below.

2. Load/create a species and associated response curves
This example shows the workflow for calculating HSI for Otter (Lutra lutra).
Otter habitat suitability is (amongst others) dependent on water depth and the amount of submerged vegetation.
Submerged vegetation in turn is dependent on light availability, which is in this example assumed linearly-correlated to water depth. These dependencies are shown in the following flowchart.

In this example the influence of salinity gradient and other factors is neglected for the sake of brevity.
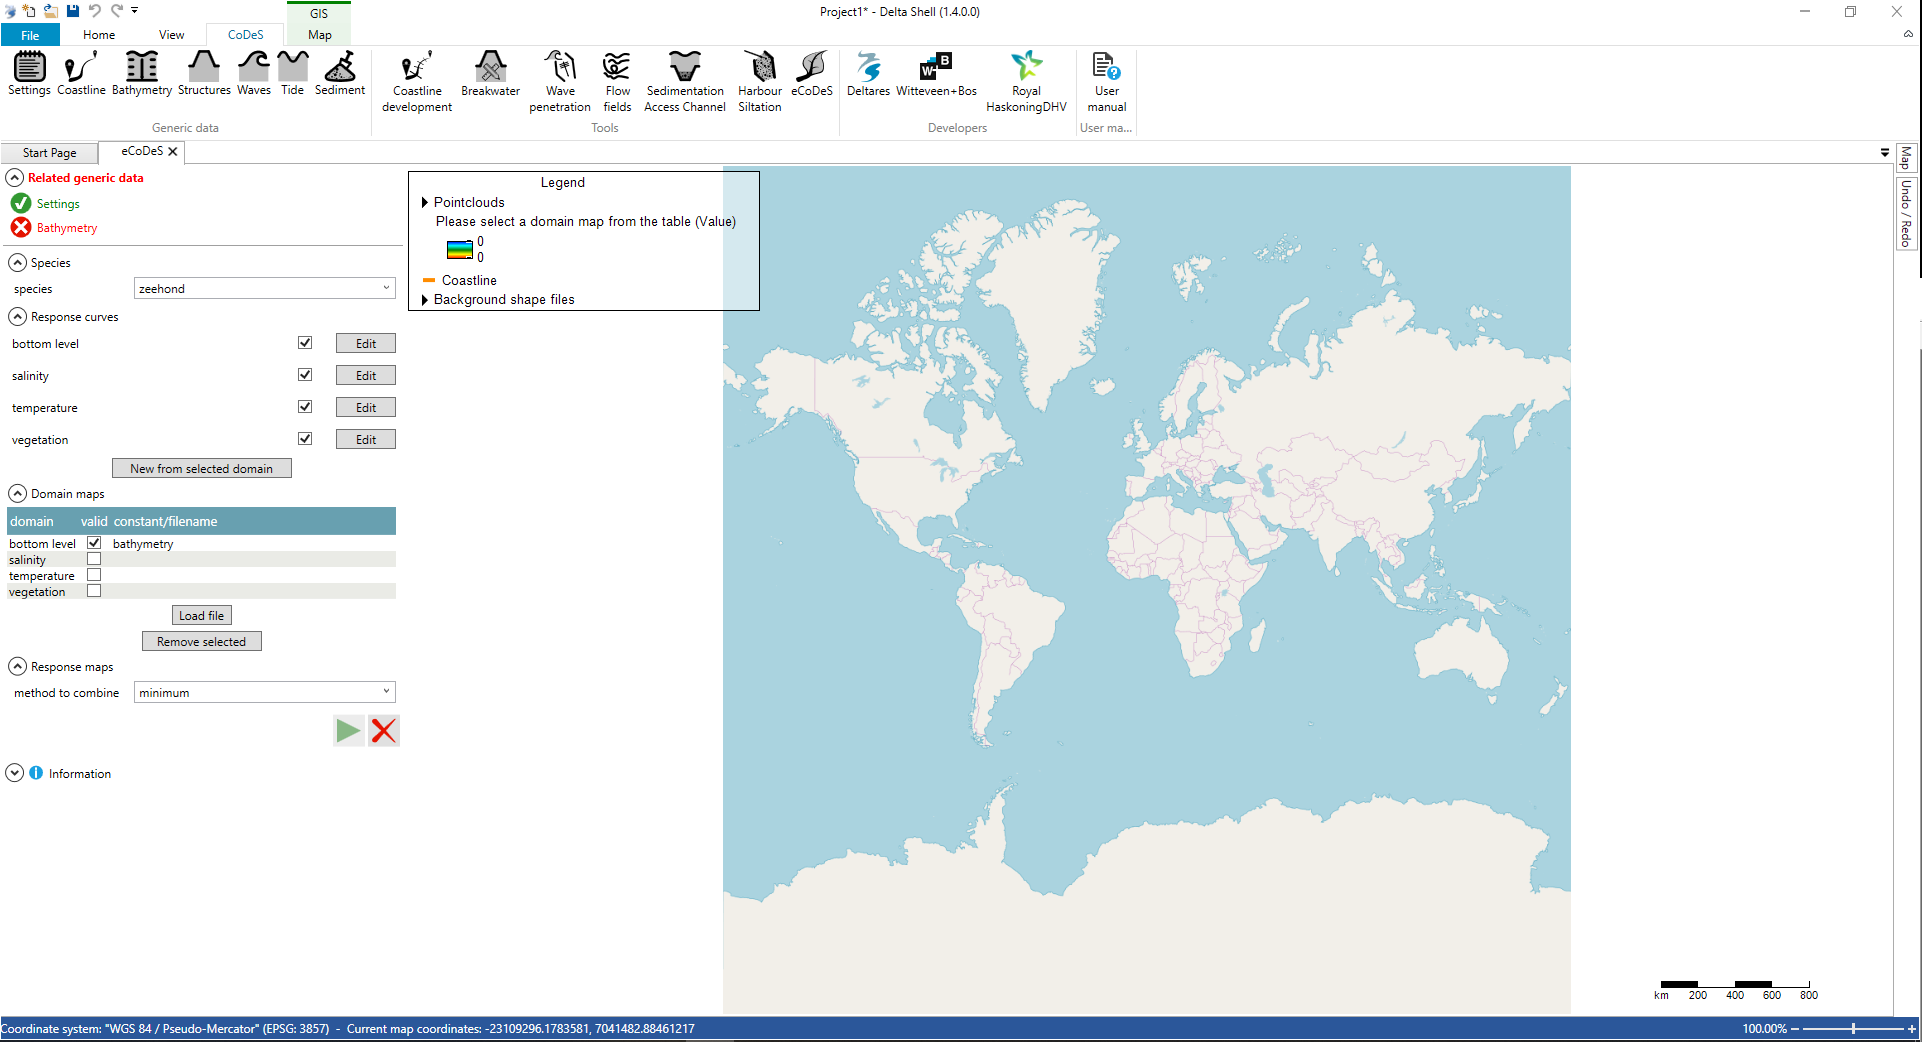
The otter and its considered response curves can be incorporated in eCoDeS as follows:
After completing step 1 (loading spatially varying bathymetry data), the response curve can be adjusted by clicking the edit button of the required domain in the “response curve” panel.
In this example the response curve for ”submerged vegetation” (waterplanten) related to ”bottom level” is adjusted. Click on "Update graph" to renew the graph representation of the response curve.
The horizontal (x) axis is the domain value (bathymetry in this case), the vertical (y) axis represents the suitability index of the considered species in relation to the domain.
In the table below, the recalculated response is shown for submerged vegetation, calculated with the values from the Ecological knowledge base of HABITAT, combined with a default water extinction coefficient k=1.

After pressing “keep changes”, the response curve is stored (also on your PC for later use) and you can close the response curve panel by clicking on the "X".
3. Generate HSI response map for the species
Clear the tick at “vegetation” under response curves, as in this example the submerged vegetation is only dependent on water depth.
Note: the calculate button (green “play” button) is now greyed out; this can be fixed by closing the eCoDeS tool and reopening it (known synchronisation bug).
After pressing the calculate button the following screen appears:

The response map associated with submerged vegetation (considering water depth) is now shown on the map and appears under the “domain maps” panel.
4. If needed use the output for another specie and repeat step 2 and 3
Now that the HSI response map for submerged vegetation was calculated during step 3, the HSI response map can be calculated for the Otter.
In this example we assume that the HSI for submerged vegetation (0-1) is a proxy for vegetation density (0-100%), e.g. a high HSI is related to high vegetation density.
The GUI should be restarted again (close and reopen eCoDeS tool) in order to make the calculated domain map for submerged vegetation available. One need to add the map “submerged vegetation - bottom level” to the domain maps.
Next, make a new species by typing “Otter” in the species panel. Now you can edit the response curves for “Otter” for domain maps “bottom level” and “submerged vegetation - bottom level” using the information in the Ecological Knowledge Base for the Otter, see the Figure below.

After creating the Otter and its response curves, the new HSI response map can be calculated using the calculate (play) button.
When combining multiple response curves into one response map, the “method to combine” can be used, which can be set to the minimum, average or maximum response of all selected response maps.
When using the “minimum” method, the results as presented in the Figure below are obtained for “Otter”.

Examples
No example is available (yet).