Threshold Overview display
The threshold display is a display plug-in that allows the user to see at a glance which locations have forecasted threshold crossings, a summary of alarms and more detailed information about specific site forecasts. For a description of the functionality available - please see the user guide.
The Id of the threshold display is identified in the DisplayInstanceDescriptors. When available on the file system, the name of the XML file for configuring the display with an Id of e.g. Threshold overview display is for example:
Thresholds_overview_display 1.00 default.xml
Thresholds_overview_display |
File name as specified in the display instance descriptors |
1.00 |
Version number |
default |
Flag to indicate the version is the default configuration (otherwise omitted). |

Figure 1: Root elements of the threshold overview display configuration.
general

Figure 2: General elements
This section gives the title of the dialog and allows the user to filter for workflows which are to be displayed e.g. Coastal_Forecast
displayDescriptor

Figure 3: Display descriptor elements
The section of the configuration forms the main part of the configuration. Each "tab" has different functionality and shows a different aspect of the data. Tab 1 shows multiple hour threshold crossing aggregates (i.e. highest crossing over 4 hours). Tab 2 shows highest alarms on an hourly basis. Tab3 gives a text summary of alarms and the optional tab 4 can be used to show additonal site data.
inputVariable
Standard timeseries set with variable ID required
columnAttributes
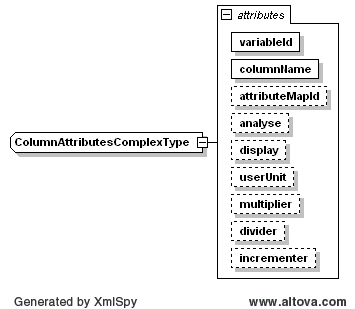
This section of the configuration relates specifically to the configuration of the site data in tab4.